Was ist Statistical Mapping?
Das Kernkonzept
Statistical Mapping analysiert historisches Preisverhalten, um wahrscheinliche Preisbereiche und Schlüssellevel für aktuelle und kommende Perioden zu projizieren. Durch die Auswertung früherer Marktdaten erkennt das Tool Muster darin, wie sich Preise in bestimmten Zeitfenstern oder Handelssessions typischerweise bewegen.
So funktioniert es
StatMap wertet historische Sessions (Standard: 60 Perioden) eines Timeframes aus, um statistische Projektionen zu berechnen. Für jede historische Periode erkennt der Indikator, ob der Schlusskurs positiv oder negativ war, misst die wesentlichen Bewegungen und leitet daraus typische Verhaltensmuster ab.
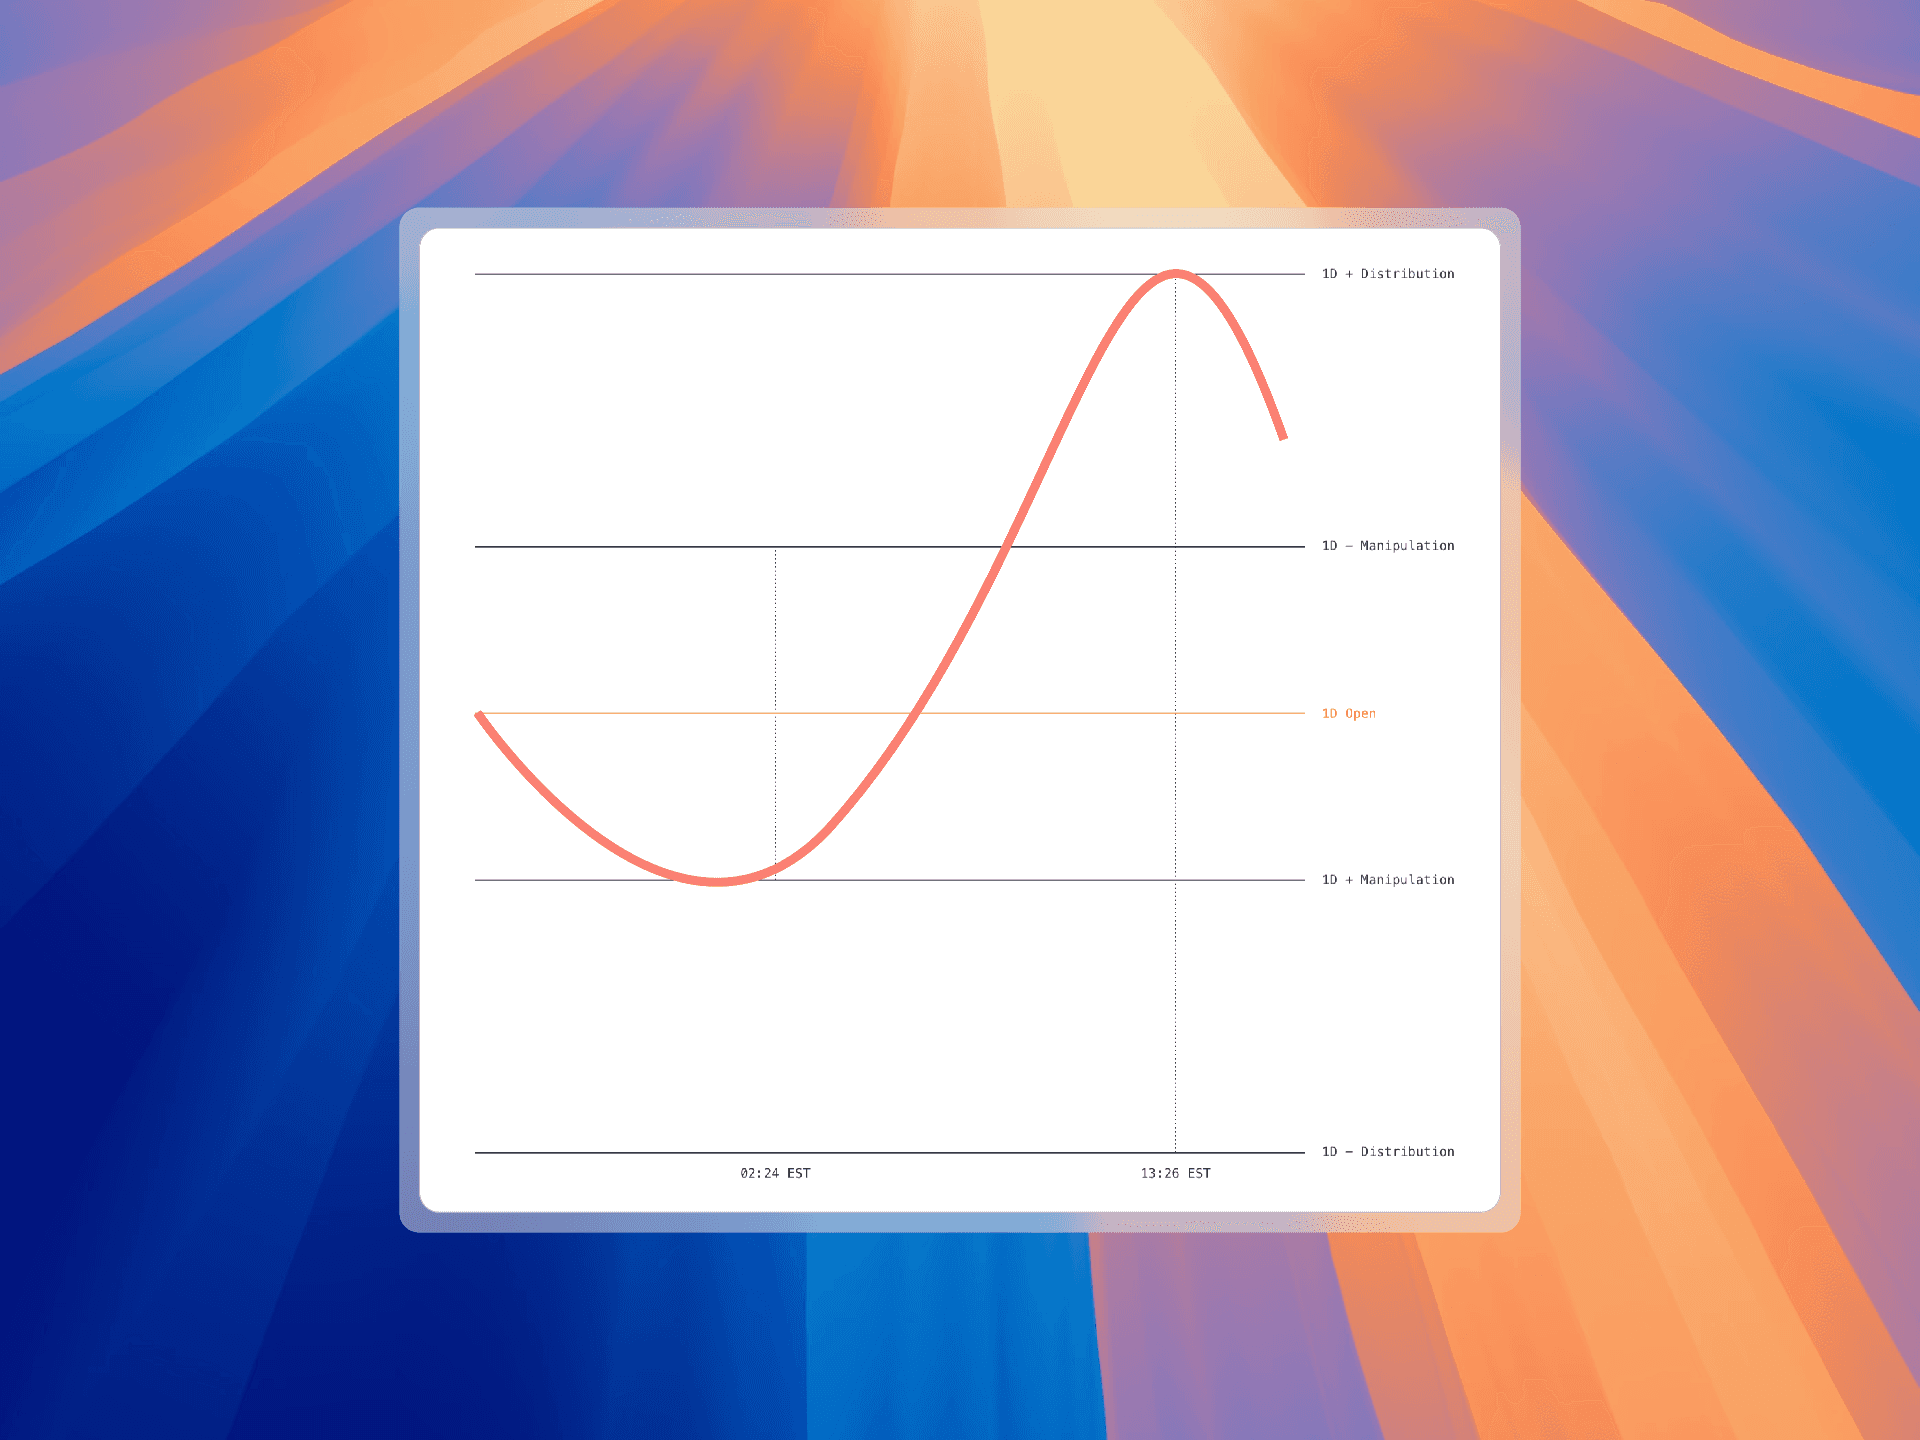
Die fünf Projektions-Level
Statistical Mapping projiziert fünf zentrale Preislevel vom aktuellen Open aus:
[+] Distribution (+D): Durchschnittliche günstige Aufwärts-Extension ab Open
[-] Manipulation (-M): Durchschnittlicher ungünstiger Docht nach oben ab Open
Open (O): Eröffnungspreis der aktuellen Periode (Referenz)
[+] Manipulation (+M): Durchschnittlicher ungünstiger Docht nach unten ab Open
[-] Distribution (-D): Durchschnittliche günstige Abwärts-Extension ab Open
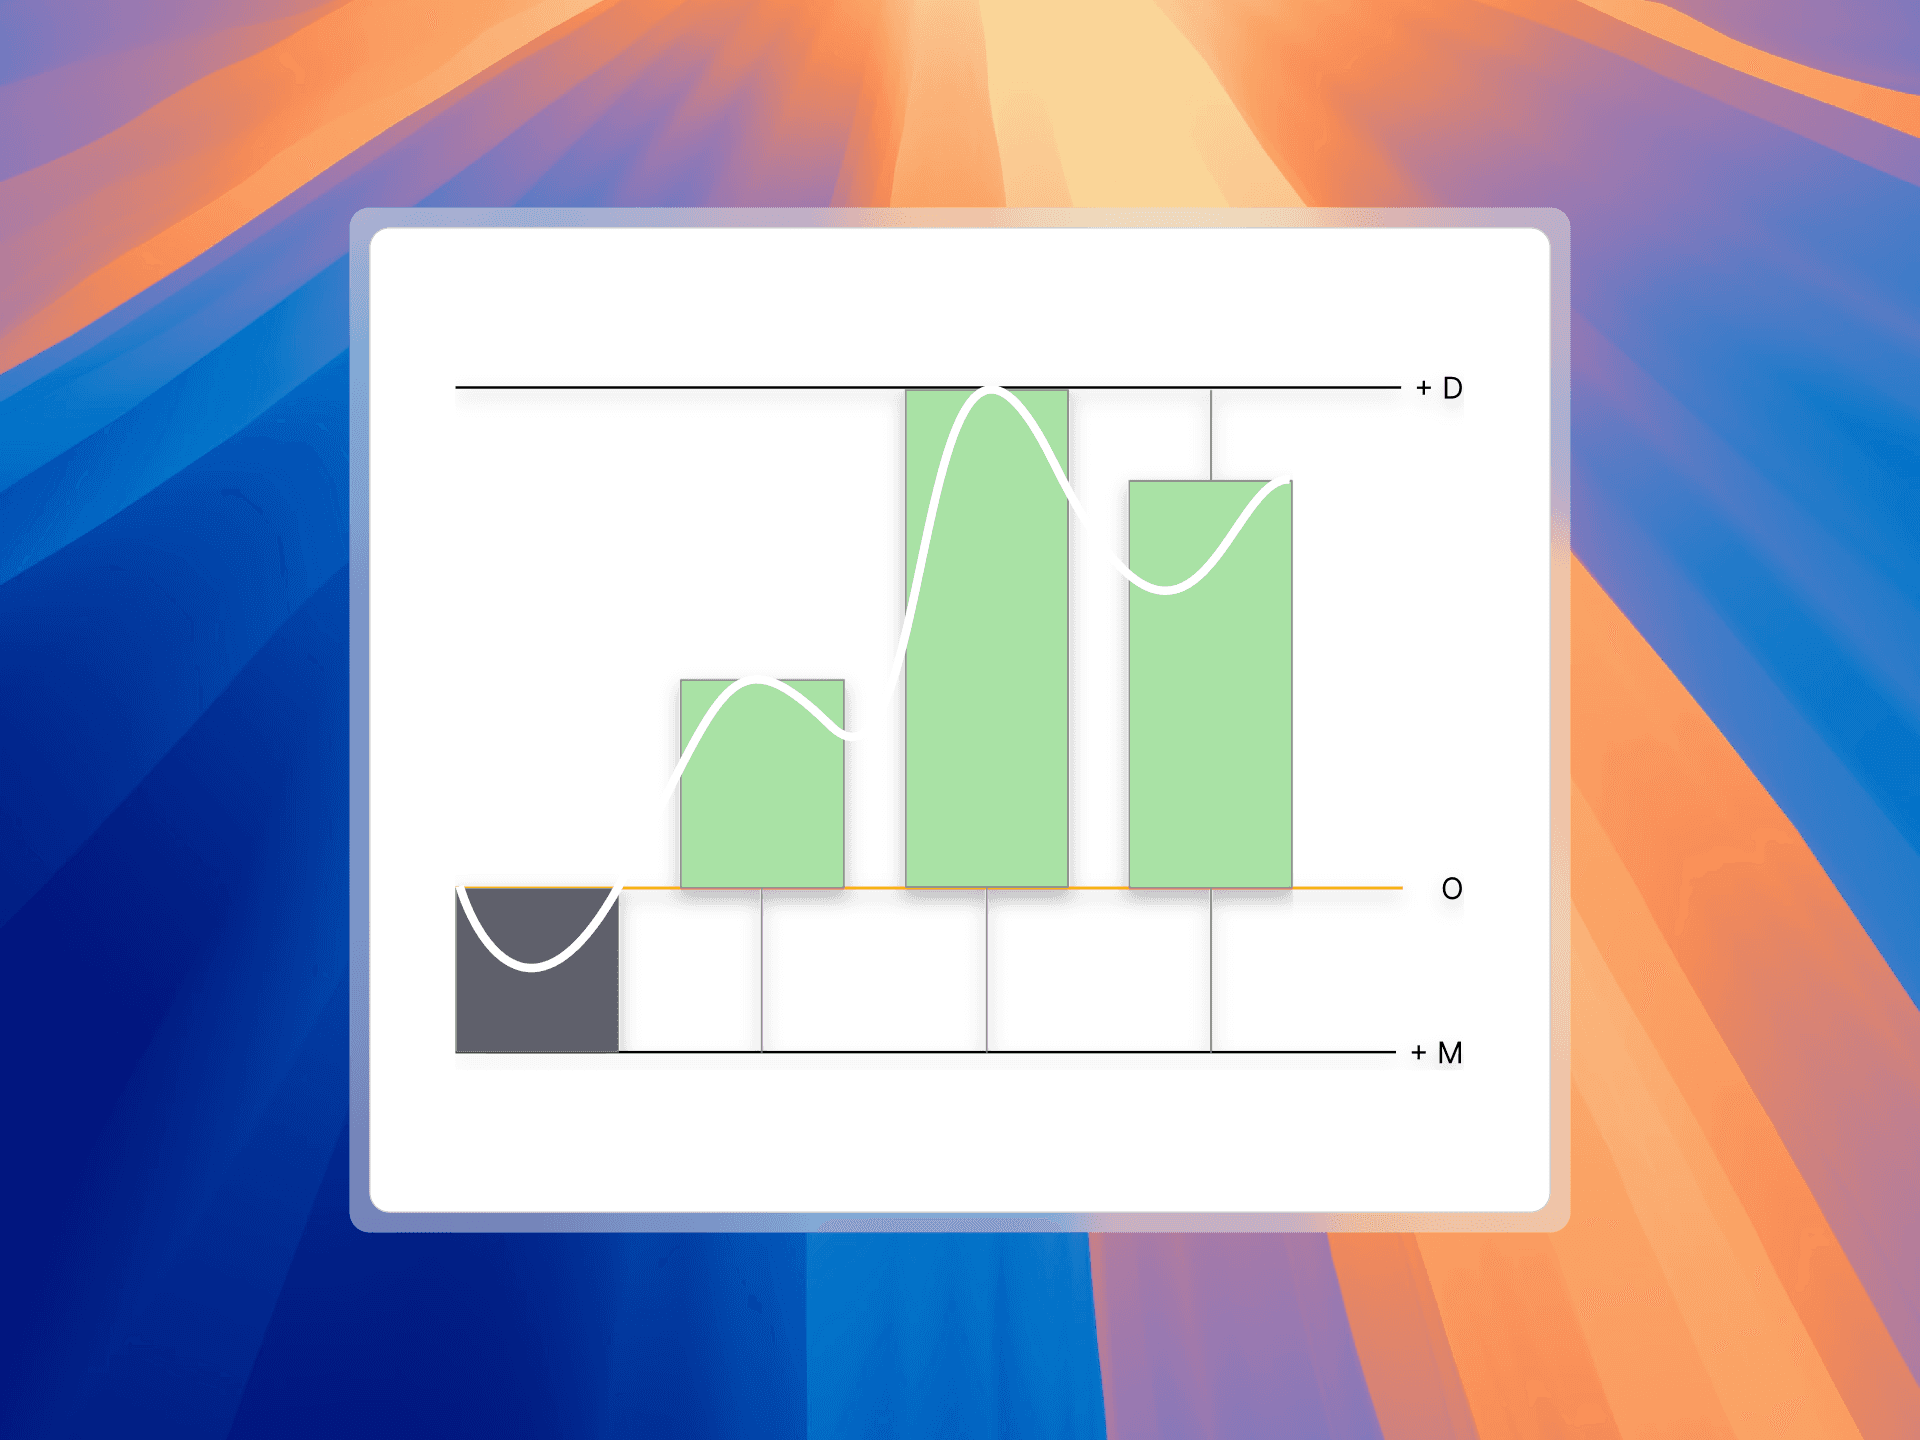
Manipulation und Distribution verstehen
In ICT-Ansätzen haben die meisten Kerzen ausgeprägte Manipulations- und Distributionsphasen.
Im bullischen Szenario liegt die Manipulation unterhalb des Open und kann Trader in Short-Positionen locken, bevor die eigentliche Distribution oberhalb des Open die Preise höher treibt.
Im bärischen Szenario liegt die Manipulation oberhalb des Open und zieht Trader in Longs, bevor die Distribution unterhalb des Open die Preise drückt.
Wichtige Funktionen
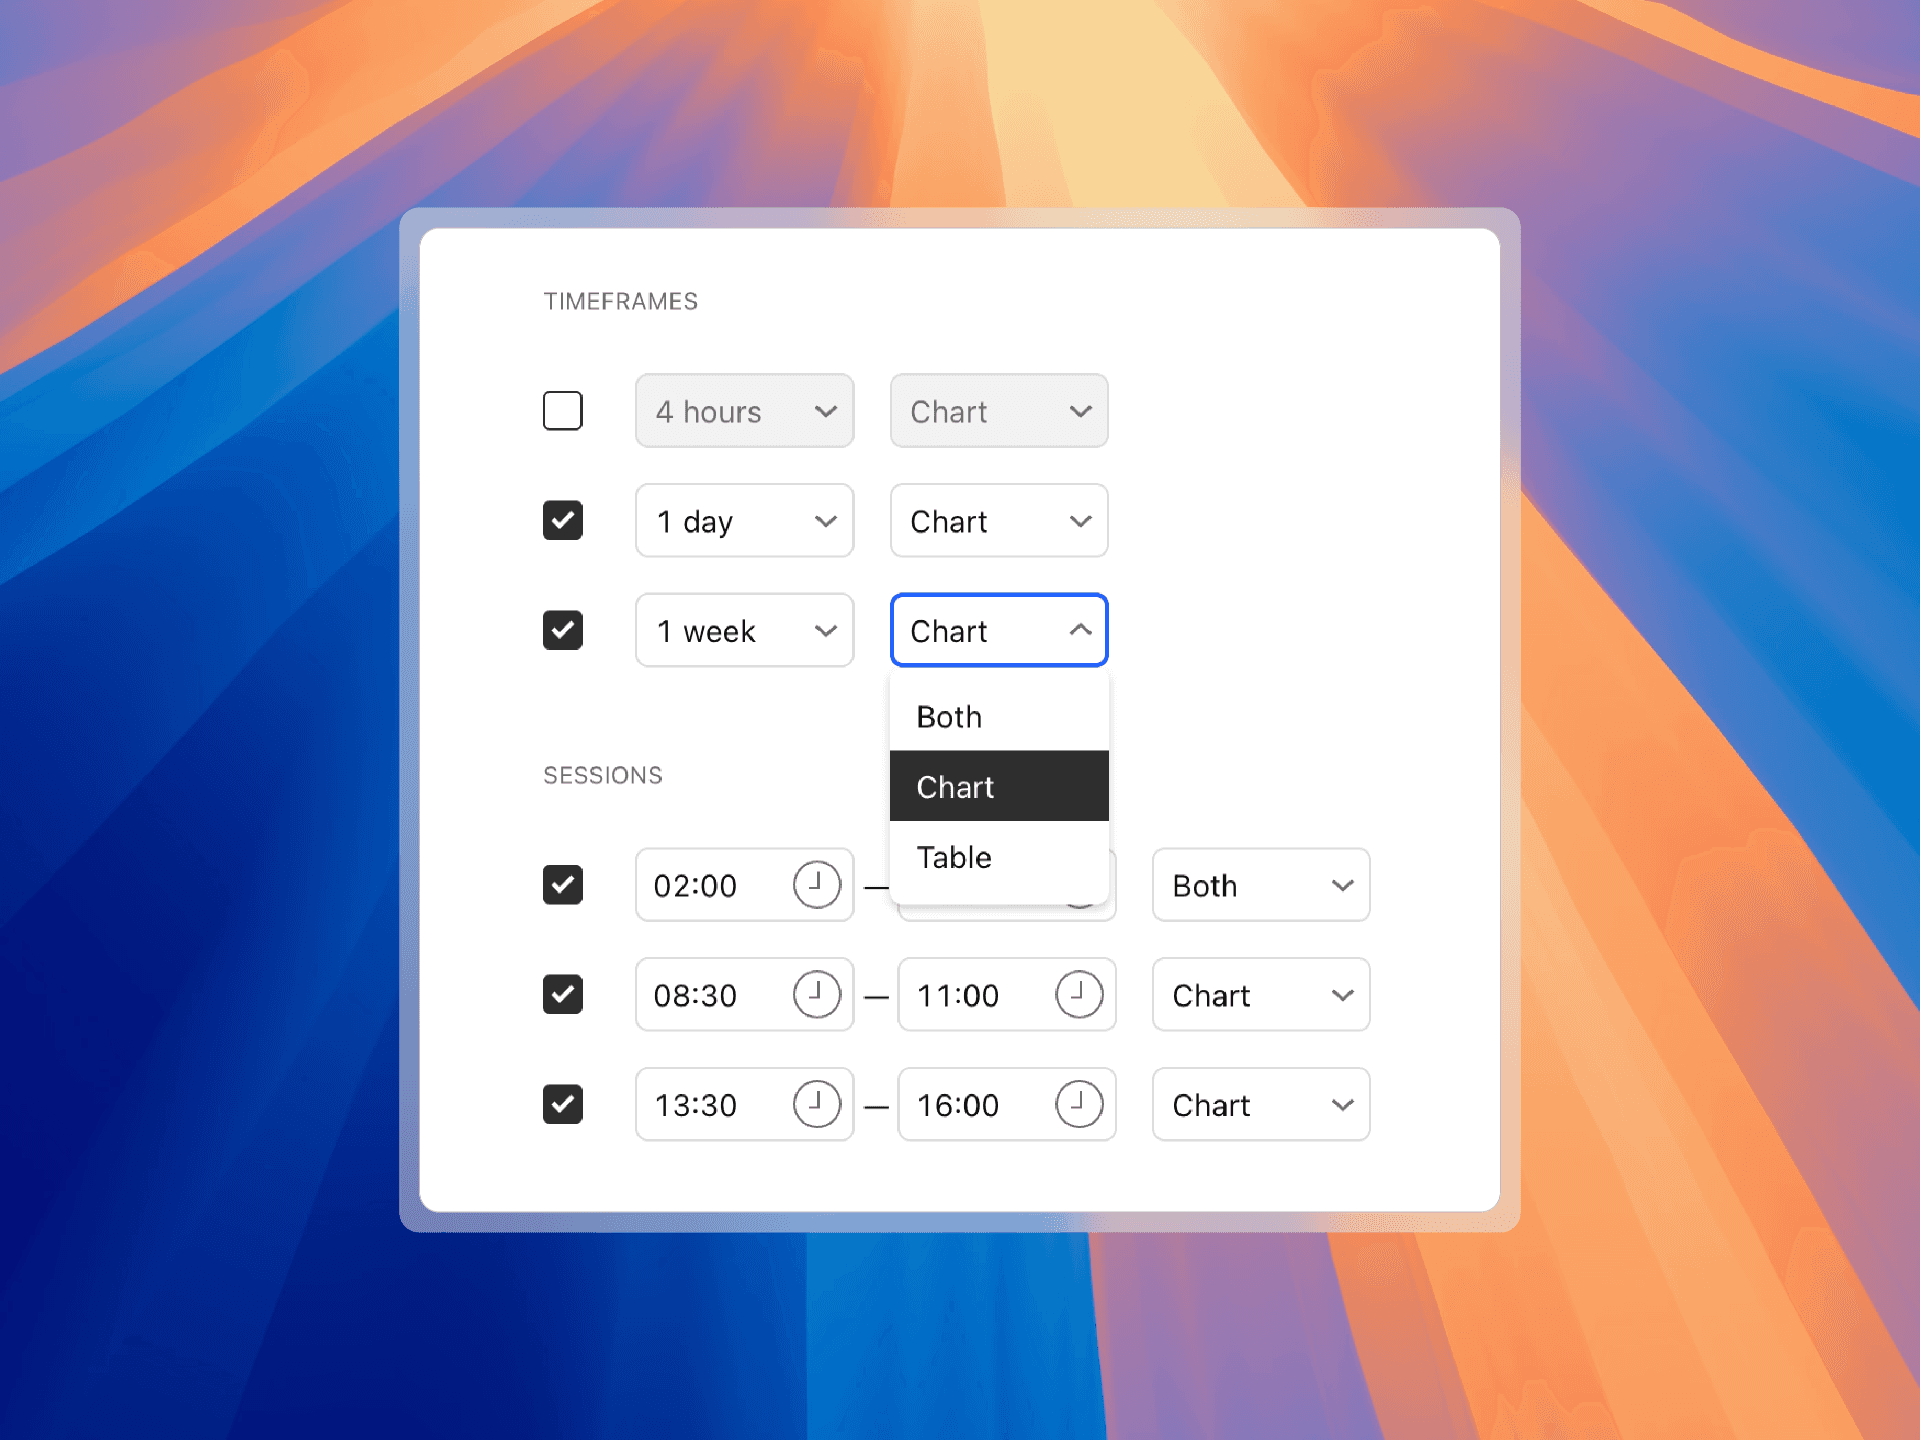
Timeframe-Analyse
Bis zu drei standardisierte Timeframe-Projektionen gleichzeitig. Jede aktivierte Zeiteinheit berechnet eigene Manipulations- und Distributionslevel, sodass mehrere Perspektiven auf einem Chart liegen.
Individuelle Session-Analyse
Neben Standard-Timeframes unterstützt Statistical Mapping bis zu drei Session-basierte Projektionen. Ideal, wenn du auf spezifische Handelszeiten wie London Open, NY Session oder Asien fokussierst statt auf Tageskerzen.
Das Tool kann an bestimmte Zeiten (z. B. Markteröffnung) angeheftet werden, nicht nur an Standardkerzen.
Zeit-Projektionen
Statistical Mapping zeigt neben Preisleveln auch erwartete Zeiten für Hochs und Tiefs basierend auf historischen Mustern. So erkennst du, wo und wann sich Bewegungen wahrscheinlich ereignen.
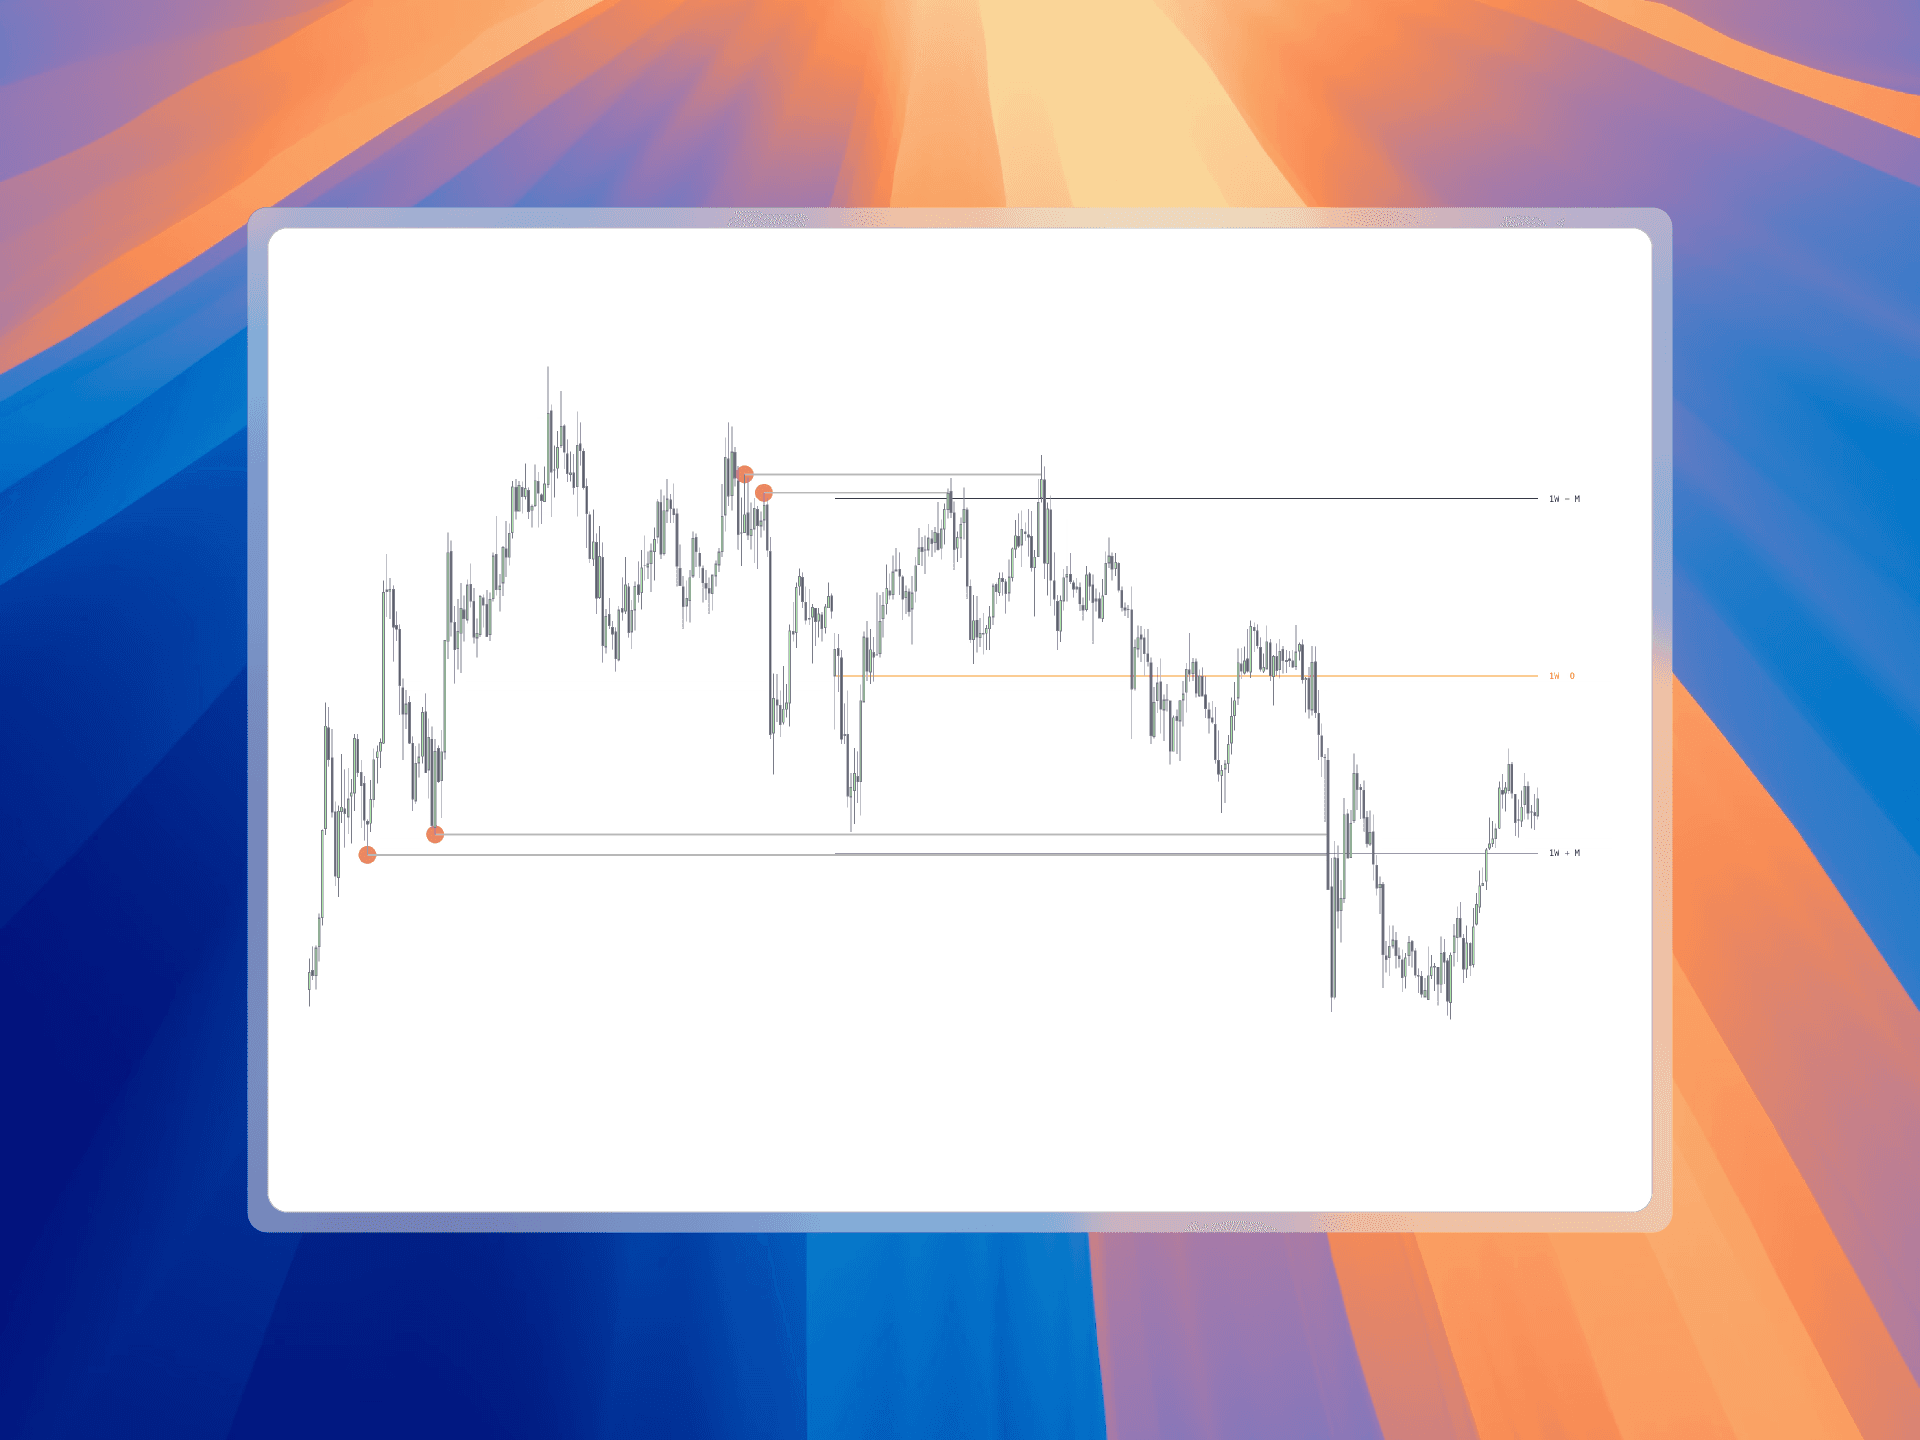
Liquiditäts-Analyse
Das Tool erkennt Swing-Highs/-Lows, die zu projizierten Leveln passen, und trackt, wann sie „abgeräumt“ werden. Damit findest du Zonen, in denen viele Stopps liegen – bevorzugte Ziele institutioneller Akteure.
Liquiditätspools werden visualisiert: durchgezogene Linien für unberührte, gestrichelte für abgeräumte. Du kannst Sensitivität und Anzeige (alle vs. nur Pre-Session-Liquidität) konfigurieren.
Liegt Liquidität nahe statistischen Leveln, entstehen oft markante Umkehrpunkte. Die Kombination aus Liquiditätsanalyse und Statistical Mapping zeigt, wo Smart Money vermutlich Stopps jagt und wie der Preis an Konfluenzzonen reagiert.
Das StatMap-Tool in TradingView
Der Indikator ist als OHLC Statistical Mapping [Pro+] auf TradingView veröffentlicht. Er vereint Kerzen-basierte (OHLC) und Session-basierte Projektionen in einem Tool.
Echtzeit-Updates
Laufende Aktualisierung der Kerzenstatistik in Echtzeit. Jede Kerze aktualisiert sofort, auch unter 1-Minuten-Frames.
Historisches Mapping
Mit dem Historical-Mapping-Feature kannst du vergangene Projektionen prüfen, um Setups zu verfeinern und zu validieren.
Praktische Anwendung
Für bullische Setups beobachtest du +Manipulation und +Distribution als Schwellen für potenzielle Umkehr. Für bärische Setups fokussierst du -Manipulation und -Distribution.
Durch die Kombination aus statistischen Preisleveln und Zeitprojektionen identifiziert Statistical Mapping Zonen für Entries, Stops und Targets mit hoher Wahrscheinlichkeit – basierend auf historischem Verhalten in vergleichbaren Perioden.
Integration mit anderer Analyse
Statistical Mapping ergänzt andere Modelle und Frameworks. Die datengetriebenen Insights lassen sich mit bestehenden Strategien kombinieren und stärken deine Markt-Story.
Related Articles
StatMap und StatVol kombinieren
Lernen Sie drei effektive Methoden, um StatMap und StatVol Indikatoren für hochwahrscheinliche Trading-Setups mit statistischen Displacements und wichtigen Levels zu kombinieren...
Custom Daily Anchor
Richte den täglichen Anker auf die tatsächliche Session deines Instruments aus, statt auf Mitternacht.