Fair Value Gaps
Learn how the three-candle Fair Value Gap forms, how bullish and bearish FVGs act as support and resistance, and when they flip into inversion FVGs.
Fair Value Gaps are a simple yet powerful three-candle formation that can help you understand market intentions.
What are FVGs
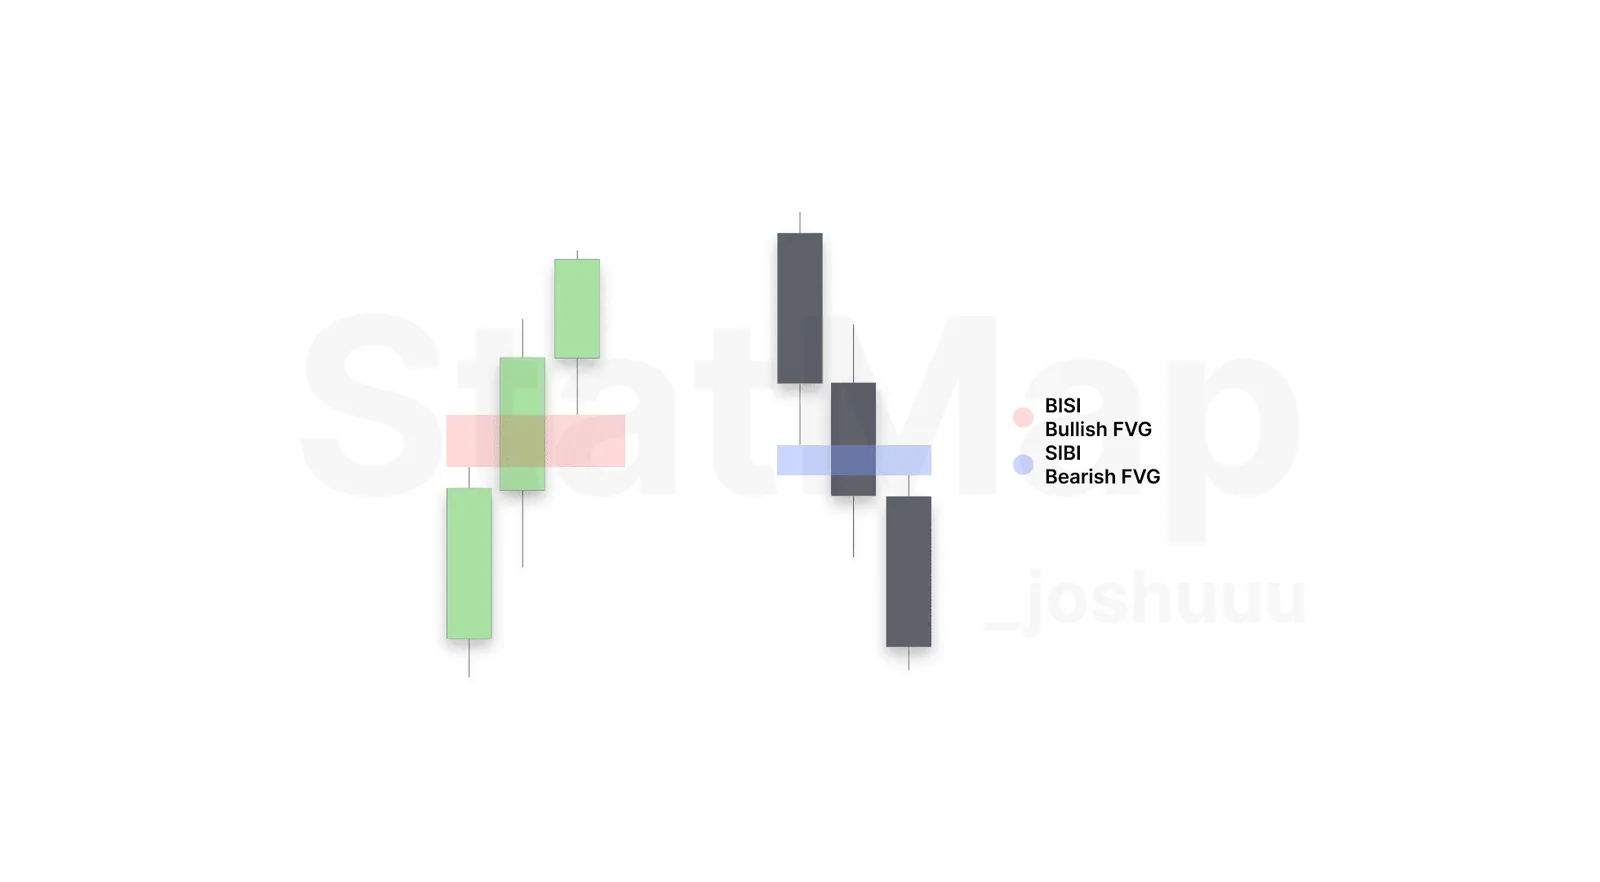
A Fair Value Gap (FVG) forms when there is no overlap between the wick of the 1st candle and the 3rd candle in a sequence.
For bullish candles, this gap occurs between the high of the 1st candle and the low of the 3rd candle. Conversely, for bearish candles, it refers to the gap between the low of the 1st candle and the high of the 3rd candle.
How to Use This Pattern
In bullish trends, bullish Fair Value Gaps, also known as 'BISI' (Buyside Imbalance, Sellside Inefficiency), often provide support as prices retrace into them before resuming higher. Similarly, in bearish trends, bearish Fair Value Gaps, termed 'SIBI' (Sellside Imbalance, Buyside Inefficiency), often act as resistance zones, preventing the price from moving higher after retesting.
Inversion FVGs
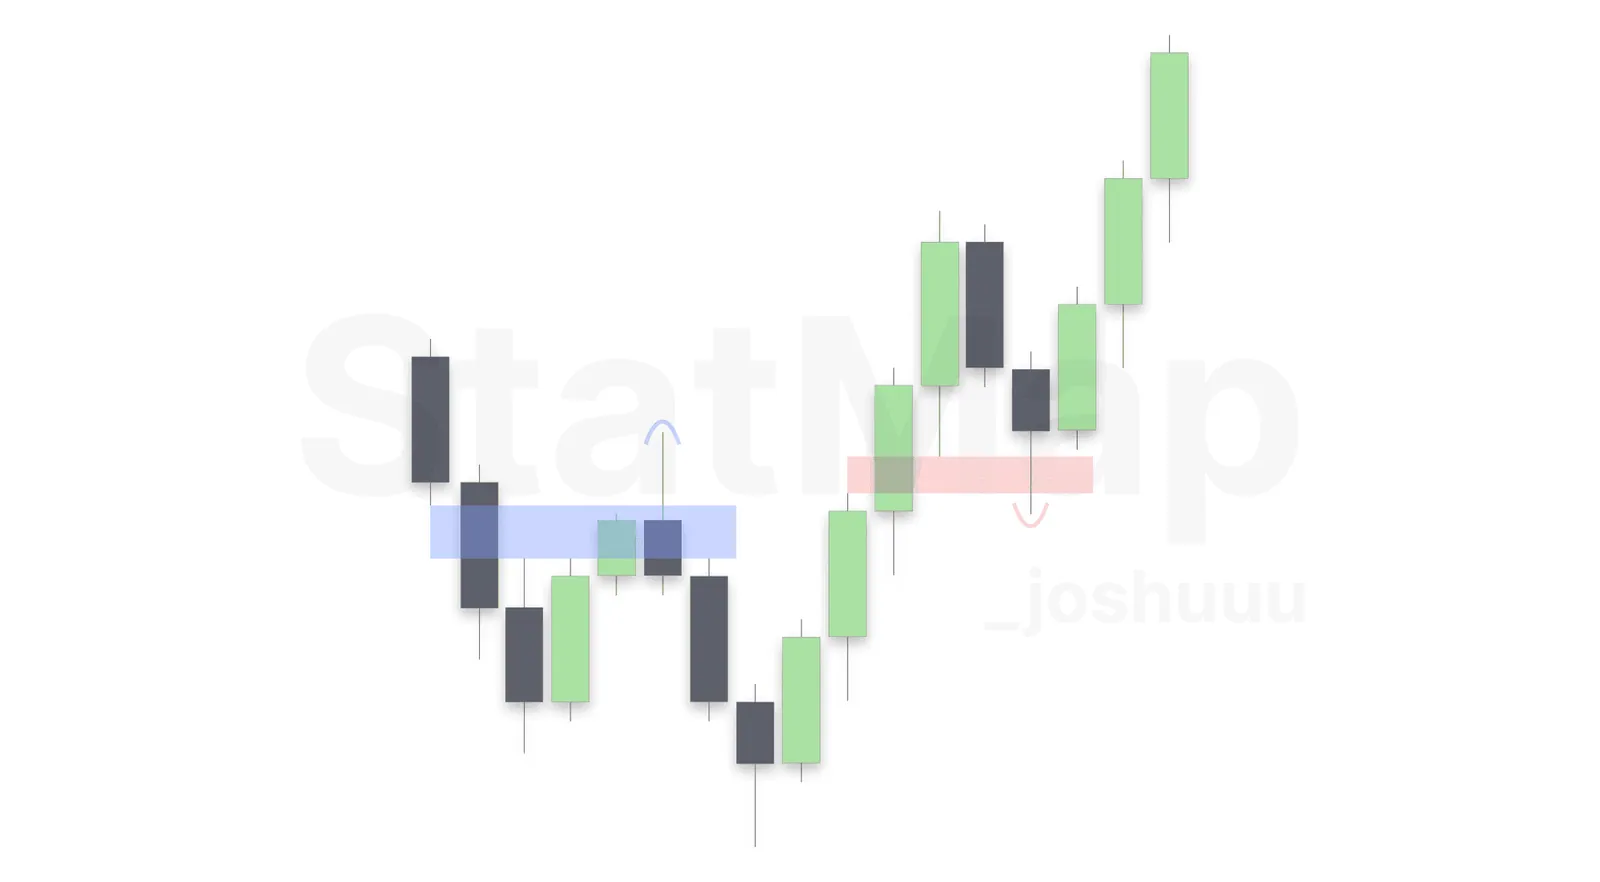
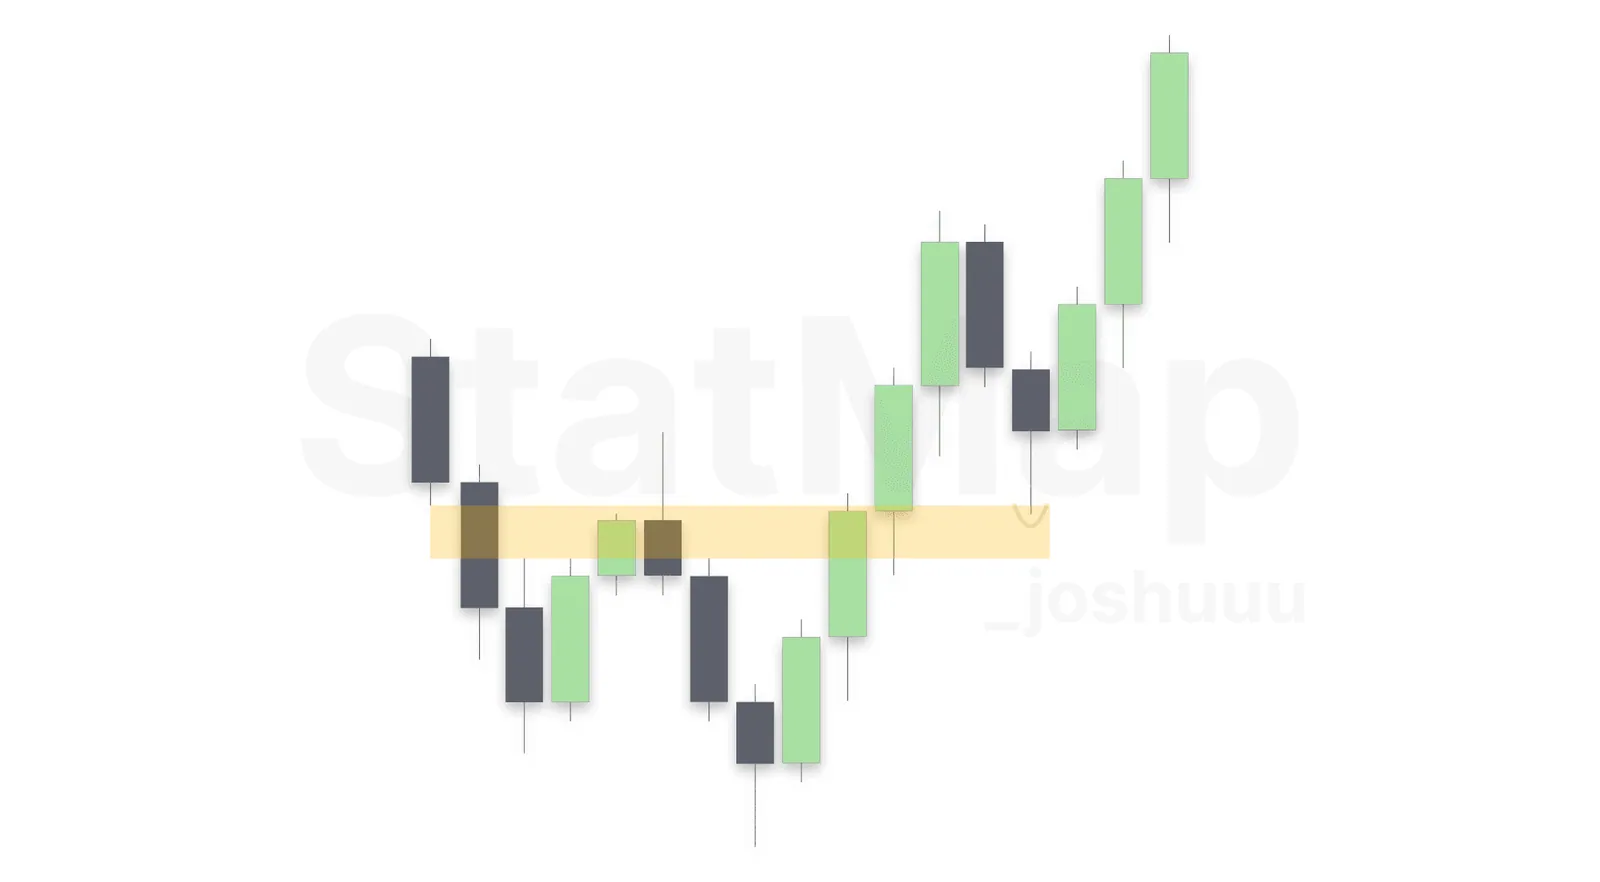
If a bearish FVG fails to act as resistance and the price closes above it, transitioning the market into a bullish trend, the bearish FVG may flip its role and become an area of support. Similarly, if a bullish FVG fails to act as support and the price closes below it, transitioning the market into a bearish trend, the bullish FVG may turn into a resistance zone.
An inverted FVG is referred to as an Inversion FVG, abbreviated as IFVG.
Filtering FVGs with Statistical Volatility°
Not every gap carries the same weight. In Statistical Volatility° you can set the displacement Type to FVG, so only gaps left by a statistical displacement are drawn. That separates gaps created by unusually large candles from everyday noise. Learn more in What is Statistical Volatility?, or see how FVGs combine with breaker blocks in the Breaker/Unicorn setup.
Put it on your chart
Get Statistical Mapping° and Statistical Volatility° for TradingView, or ask StatMap AI about settings and setup.
Related articles
Understanding the Breaker/Unicorn Setup
Learn how the breaker block captures liquidity before a reversal and how a Fair Value Gap inside it creates the higher probability Unicorn setup.
Understanding Accumulation, Manipulation, and Distribution in Trading
Understand the accumulation, manipulation and distribution phases of the Power of Three and how Statistical Mapping° levels help you anticipate each phase.
OHLC/OLHC – The Foundation of Price Action
OHLC and OLHC describe the order in which a candle forms its open, high, low and close. Learn how this sequence helps you read price action.