Two statistical indicators. One complete toolkit.
Statistical Mapping and Statistical Volatility work together to reveal reversal zones, displacement events, and liquidity pools.
The roadmap for price delivery.
Identify manipulation and distribution levels using historical price behavior. StatMap calculates the most probable points of reversal and continuation by projecting statistical ranges from the session open.
- Timeframe & Session Projections: Anchor daily candles or custom sessions (NYSE 09:30, London 02:00, etc.)
- Manipulation & Distribution Levels: Map historical high/low excursions and project them forward.
- Liquidity Alignment Tracking: Monitor when liquidity pools are swept relative to projected levels.
Detect the invisible hand.
StatVol measures the velocity and magnitude of price movement versus historical norms. When displacement exceeds the baseline, the indicator flags high-probability reversal or continuation zones.
- Displacement Detection: Highlight when range, body, or FVG thresholds are broken.
- Volatility Heatmap: Visualize killzones and session intensity on any timeframe.
- Configurable Alerts: Trigger one-shot notifications for creation, midpoint, or mitigation events.
How They Work Together
Built to complement each other.
Statistical Mapping reveals where price is likely to react.
Historical reversal zones and liquidity levels.
Statistical Volatility shows when unusual moves occur.
Displacement events that signal breakouts or exhaustion.
Combine both for high-probability setups.
Displacement into a distribution level with aligned liquidity.
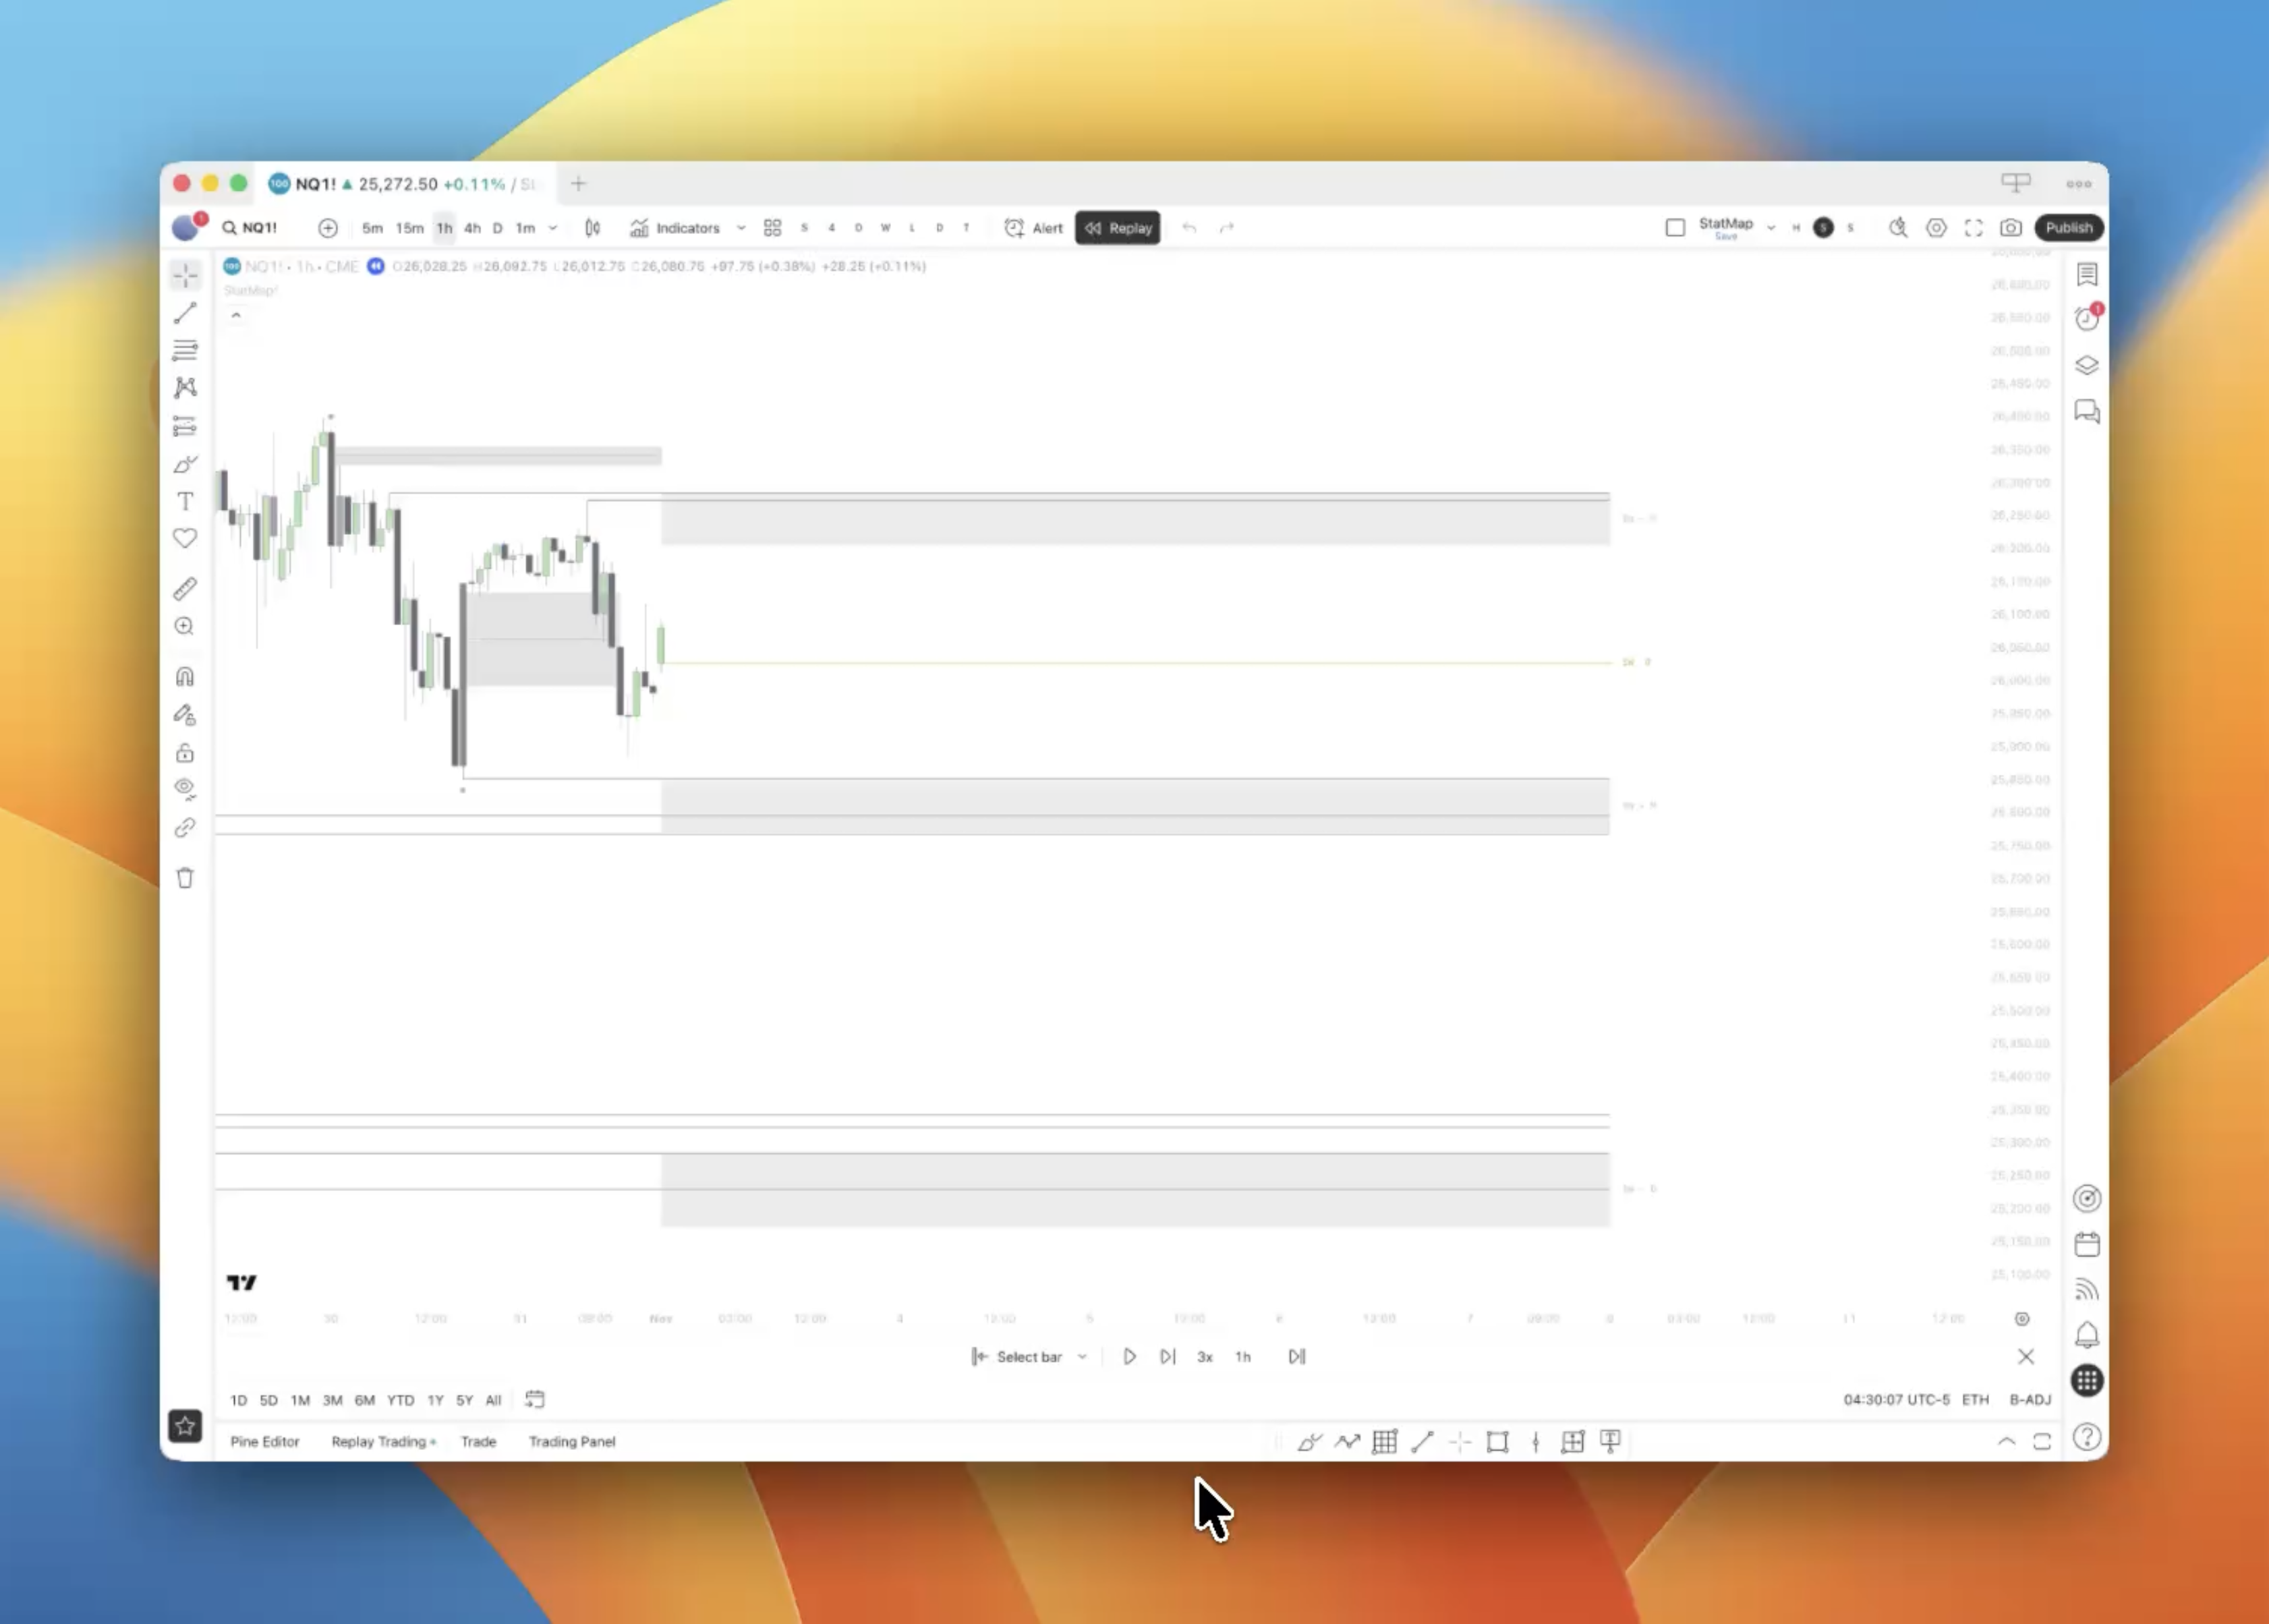
The walkthrough shows how Statistical Mapping levels line up with Statistical Volatility displacements, and how alerts trigger once per level across app, email, or webhook without chart babysitting.
You will see manipulation and distribution levels, displacement creation and first touch events, and how aligned liquidity plus displacement creates higher-probability setups.
Never Miss a Setup
Configure alerts for StatMap levels, liquidity zones, and volatility displacements directly in TradingView. Notifications trigger once per level via app, email, or webhook—no chart watching required.
- StatMap Alerts: Notify when price reaches manipulation or distribution levels.
- Liquidity Alerts: Track when liquidity zones are filled or raided.
- StatVol Alerts: Monitor displacement events across the lifecycle, from creation through exhaustion.
- Separate controls for StatMap levels vs. liquidity.
- One alert per level prevents notification spam.
- Works across any timeframe or custom session.
- Persistent settings across devices.