




Quarterly table
See which quarter of each session touched every level. Custom sessions side by side, 60 samples each.
| 02:00–05:00 (60) | 08:30–11:00 (60) | |||||||||
|---|---|---|---|---|---|---|---|---|---|---|
| +DIS | 6894.4 | 6914.4 | ||||||||
| −MAN | 6884.9 | 6898.7 | ||||||||
| OPEN | 6880.3 | 6888.8 | ||||||||
| +MAN | 6875.6 | 6878.8 | ||||||||
| −DIS | 6866.1 | 6863.1 | ||||||||
Anticipate volatility and reversal points with data
Identify key levels, volatility patterns, and reversal signals across any timeframe or ticker on TradingView.
See which quarter of each session touched every level. Custom sessions side by side, 60 samples each.
| 02:00–05:00 (60) | 08:30–11:00 (60) | |||||||||
|---|---|---|---|---|---|---|---|---|---|---|
| +DIS | 6894.4 | 6914.4 | ||||||||
| −MAN | 6884.9 | 6898.7 | ||||||||
| OPEN | 6880.3 | 6888.8 | ||||||||
| +MAN | 6875.6 | 6878.8 | ||||||||
| −DIS | 6866.1 | 6863.1 | ||||||||
Level touches, sweeps and every stage of a displacement.
Swing highs and lows near a level stay solid until they are swept.
Start the day at the bell instead of midnight.
Futures, forex, crypto and stocks. Seconds to monthly.
Compare Monday 10:00 only with earlier Mondays at 10:00. Toggle a day to see its own volatility profile.
Median ignores outliers for conservative levels. Mean reacts to every extreme and projects further from the open.
Identify key levels, volatility patterns, and reversal signals across any timeframe or ticker on TradingView.

Statistical levels reveal where price is likely to reverse based on historical behavior for any timeframe or session on any ticker.

Detects unusual volatility events when price movement exceeds historical norms. Highlights displacement zones with visual boxes and tracks when they are filled.





"I just really want to highlight how bloody amazing the OHLC Stat Map indicator is. Confluence with this has changed my game."

"It's just astonishing. I'm at a loss for words at this point. Every single day our entry function continues to appear at the Stat Map levels!"

"Seeing the stat map levels—it's spooky good. I mean it's incredible man. Definitely one of my favorite indicators."
Built to complement each other.
Historical reversal zones and liquidity levels.
Displacement events that signal breakouts or exhaustion.
Displacement into a distribution level with aligned liquidity.
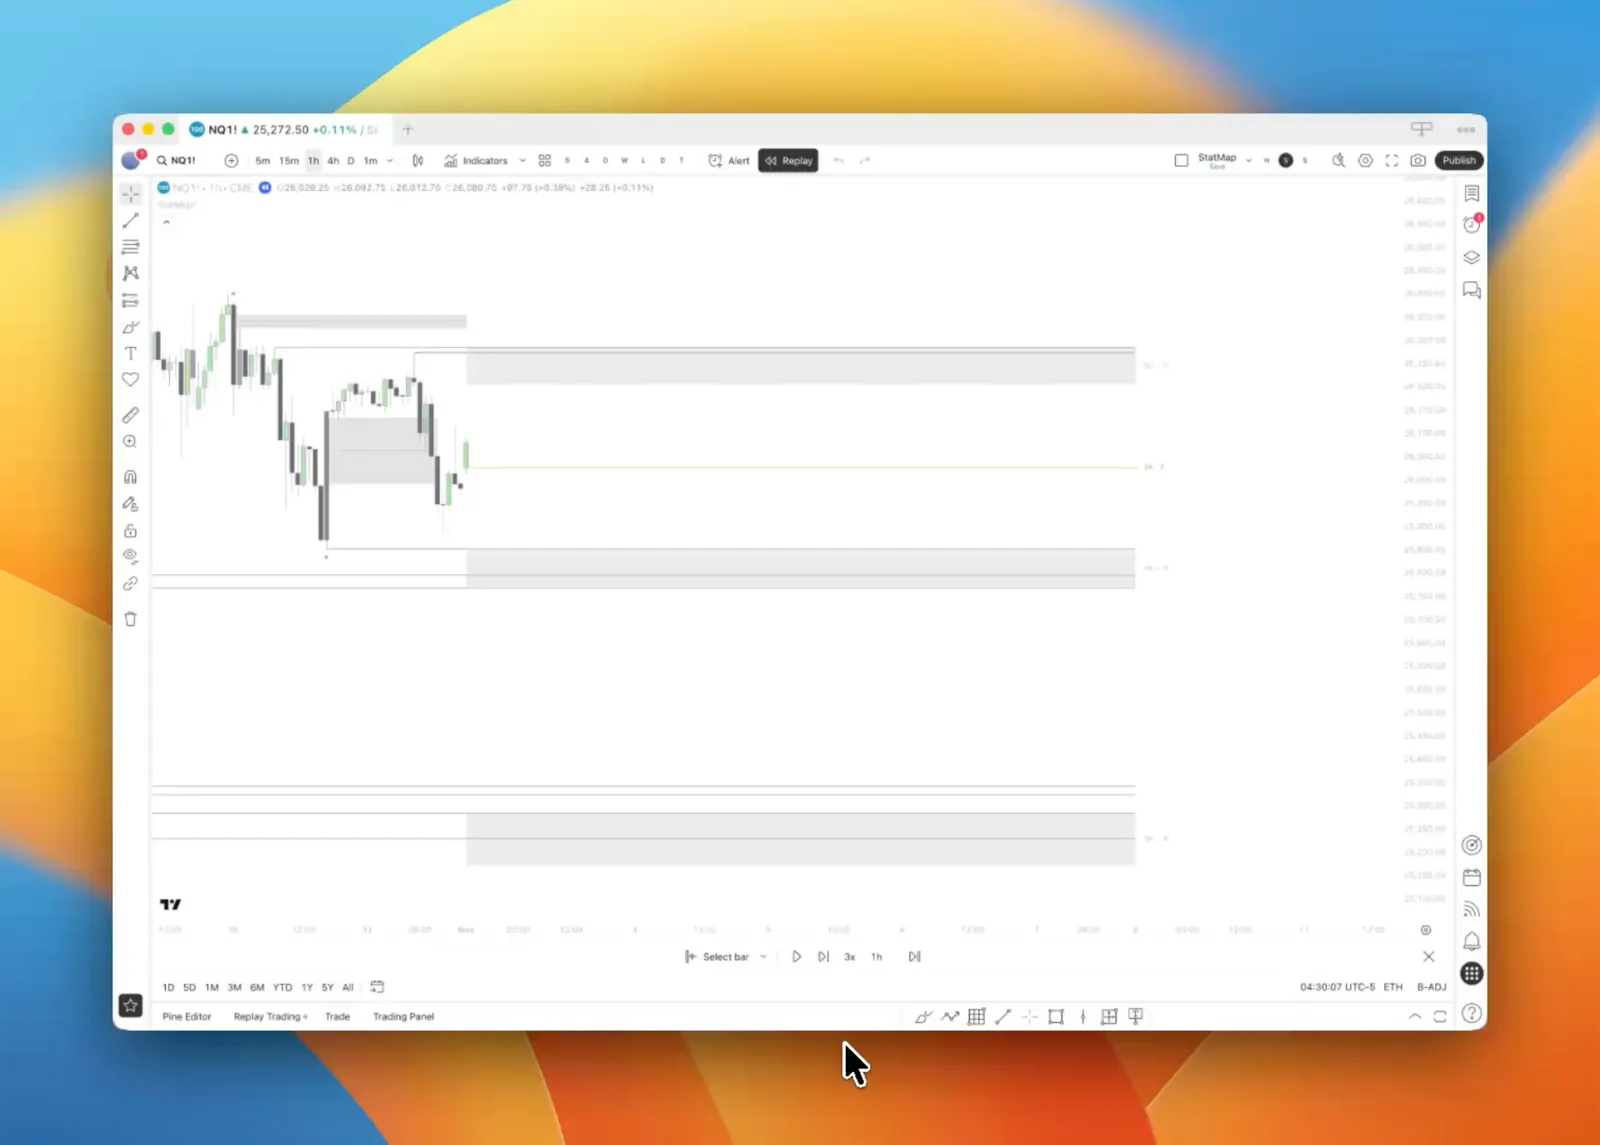
The walkthrough shows how Statistical Mapping levels line up with Statistical Volatility displacements, and how alerts trigger once per level across app, email, or webhook without chart babysitting.
You will see manipulation and distribution levels, displacement creation and first touch events, and how aligned liquidity plus displacement creates higher-probability setups.
Configure alerts for StatMap levels, liquidity zones, and volatility displacements directly in TradingView. Notifications trigger once per level via app, email, or webhook—no chart watching required.
Clear pricing options tailored to meet your needs.
billed monthly
billed quarterly
billed yearly
Billed securely through Whop. Manage or cancel your subscription anytime in your Whop account.
After checkout, claim your TradingView access in Whop. Step-by-step guide
From claiming access to dialing in your settings.
Everything you need to know about the indicators and how to use them effectively.
Mean is the arithmetic average (sum ÷ count), making it sensitive to outliers which typically projects levels further away. Median is the middle value of the historical dataset, making it resistant to extreme outliers. We generally recommend Median for more conservative, high-probability levels.
Percent is recommended for almost all assets (Crypto, Indices, Stocks) because it adapts to the price level of the asset. Points are fixed distances, which is better for specific tick-based strategies or when you need consistent pip targets regardless of price evolution.
Start with 60 for stable statistics. If you need levels that adapt faster to recent market conditions (e.g., a sudden shift in volatility), reduce this to 20-40 samples. Use “Maximum” for long-term structural analysis.
Statistical Mapping alerts are automatic; if you set an alert on the indicator, it will fire when price reaches an enabled Distribution or Manipulation level, and when a liquidity level is swept. Statistical Volatility alerts are fully configurable—you can choose to trigger on Displacement Creation, First Touch, or the Midpoint Touch.
Instead of combining data from every day together (e.g. all 10:00 AM bars), this feature separates statistics by day. For example, it will compare Monday 10:00 AM only against previous Mondays at 10:00 AM. Use this when specific days exhibit unique behaviors compared to the rest of the week.
This setting is useful when you are monitoring Higher Timeframe (HTF) displacements on a Lower Timeframe (LTF) chart. When enabled, it forces the candle colors to reflect the volatility of the current chart timeframe, rather than the HTF displacement logic, allowing you to see local volatility while monitoring HTF structure.
Plans are listed in USD per month on https://stat-map.com/#pricing: Monthly $45 (billed monthly), Quarterly $39.67/month (billed quarterly, most popular), Yearly $36.50/month (billed yearly). Every plan includes Statistical Mapping, Statistical Volatility, regular updates, and Premium Discord. Subscribe via Whop from the pricing section; after purchase claim TradingView access with the Whop claim guide under Resources.
Ask StatMap AI, our AI assistant. It knows the docs, settings and pricing.
Join our Discord community for 24/7 support.