Resources.
Deep dives into market mechanics, strategy guides, and the latest updates from the StatMap ecosystem.
Library
Browse by category
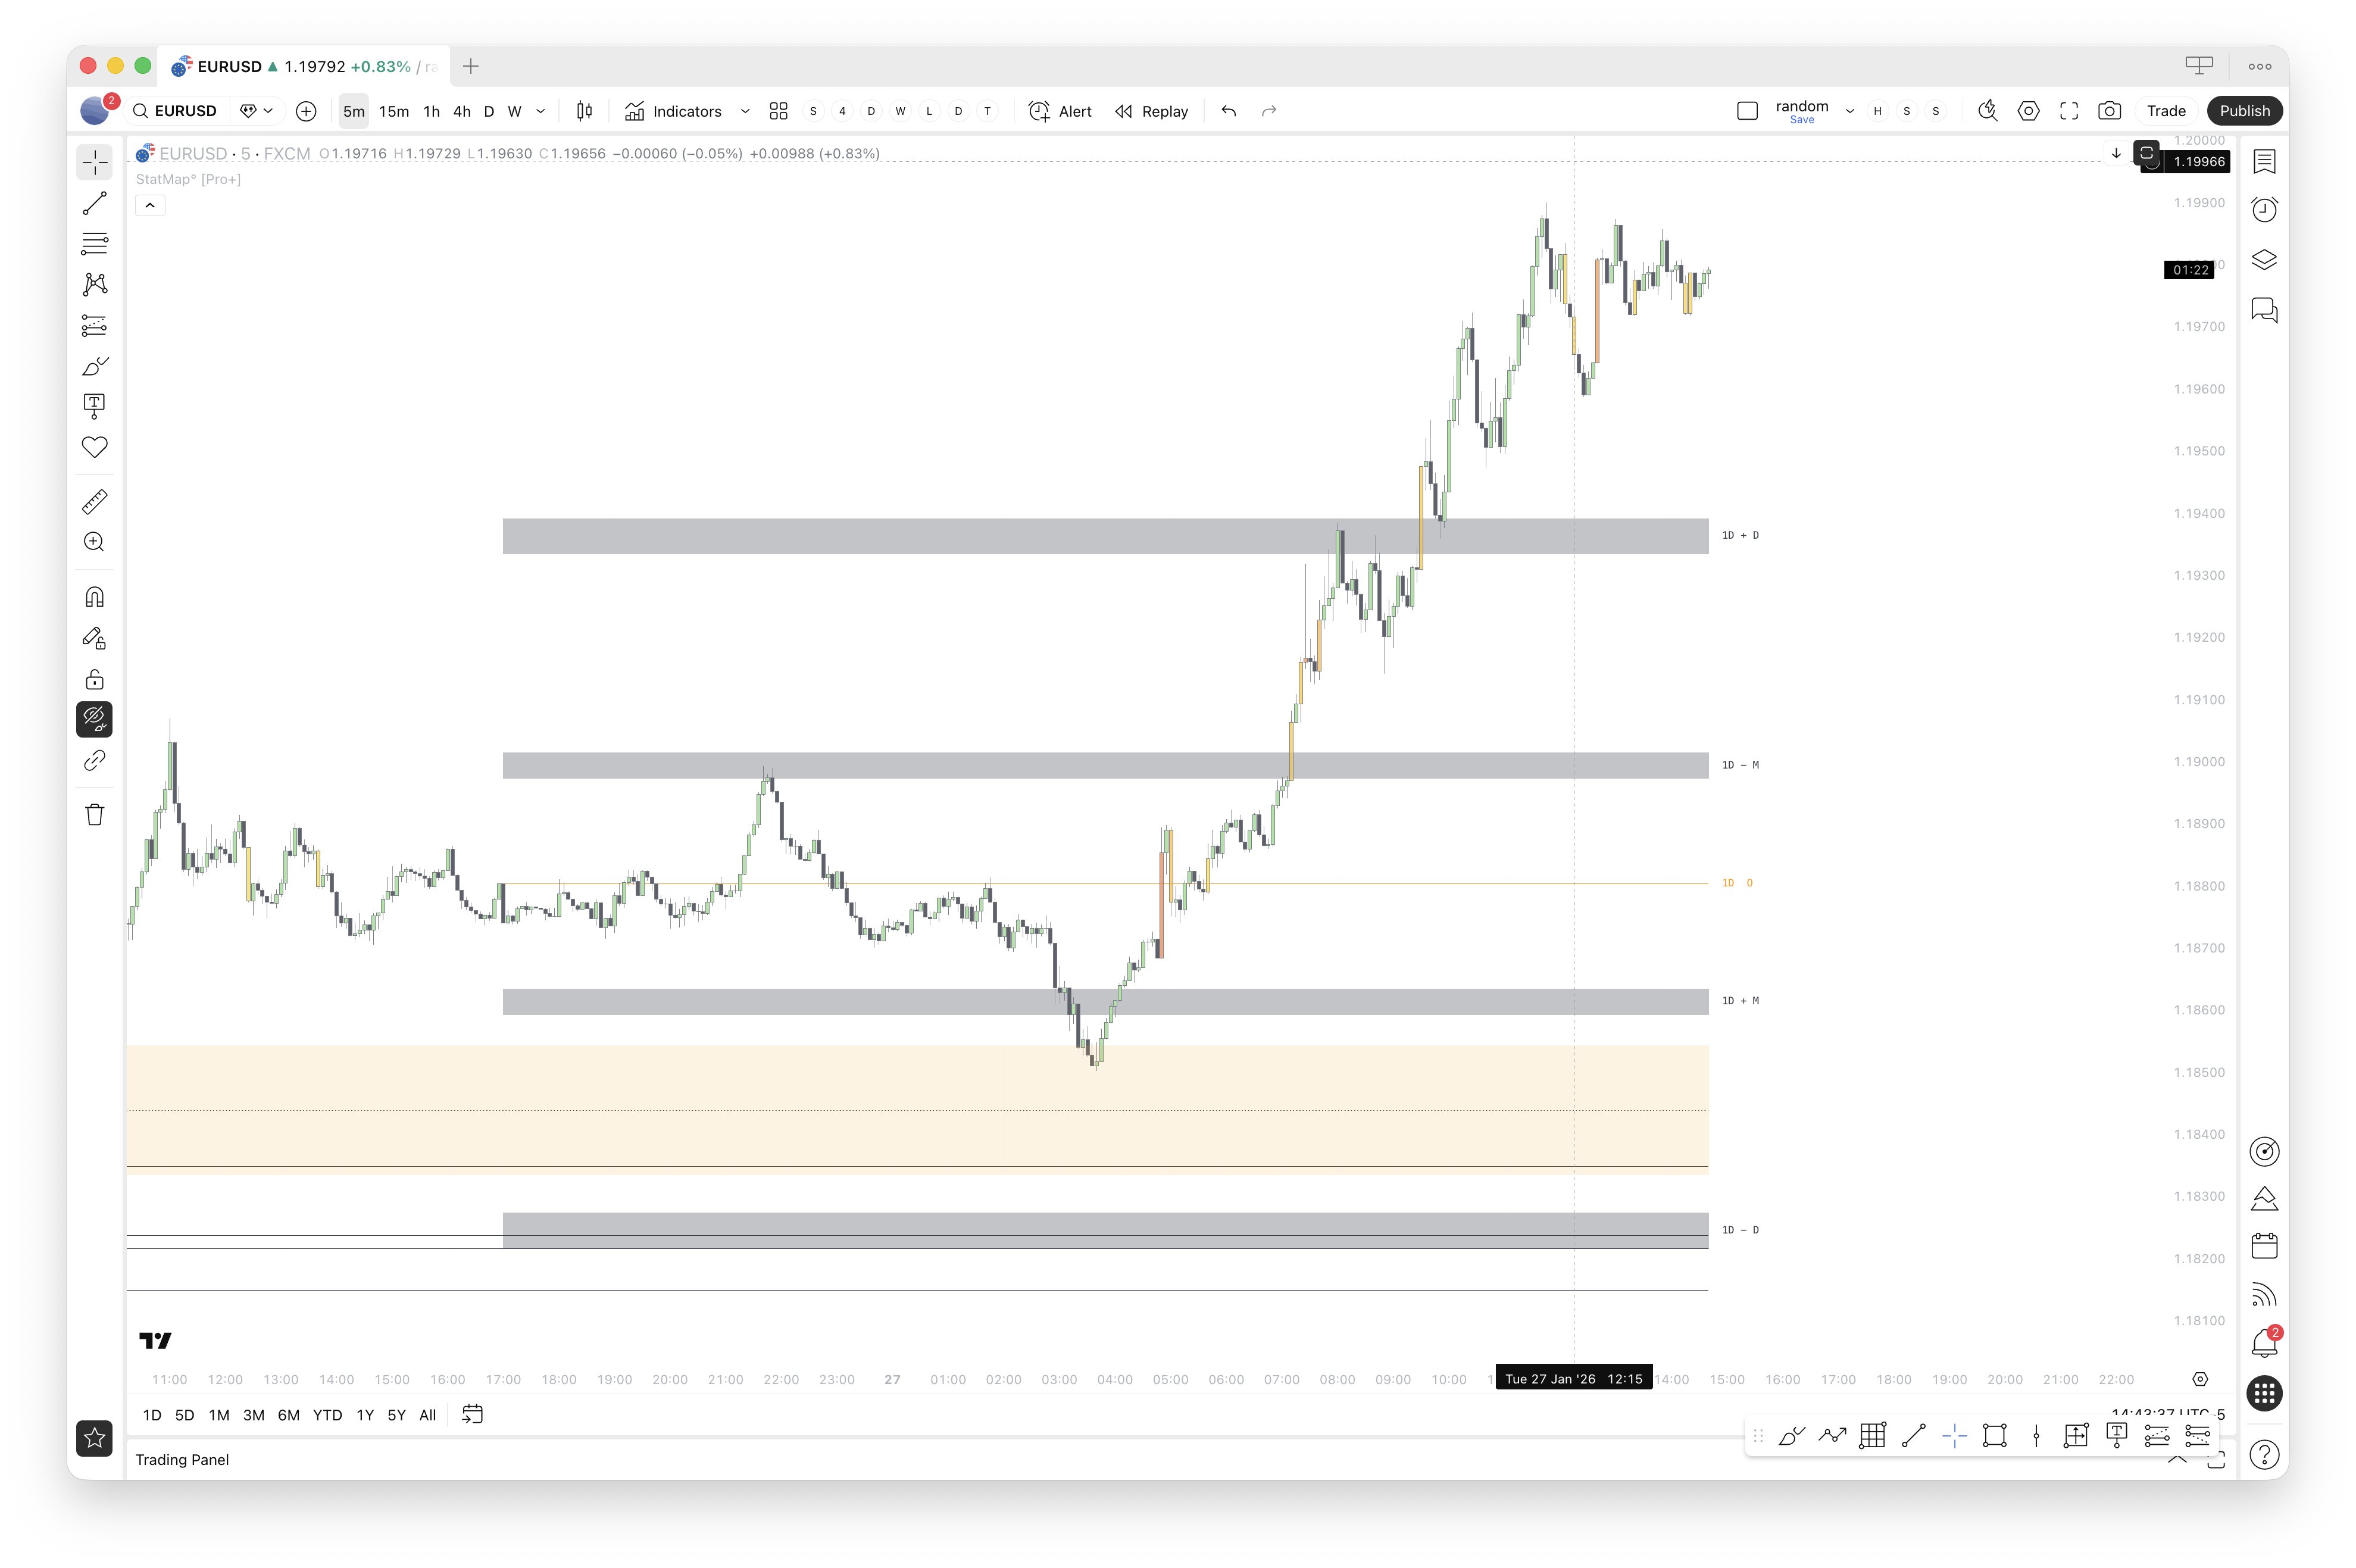
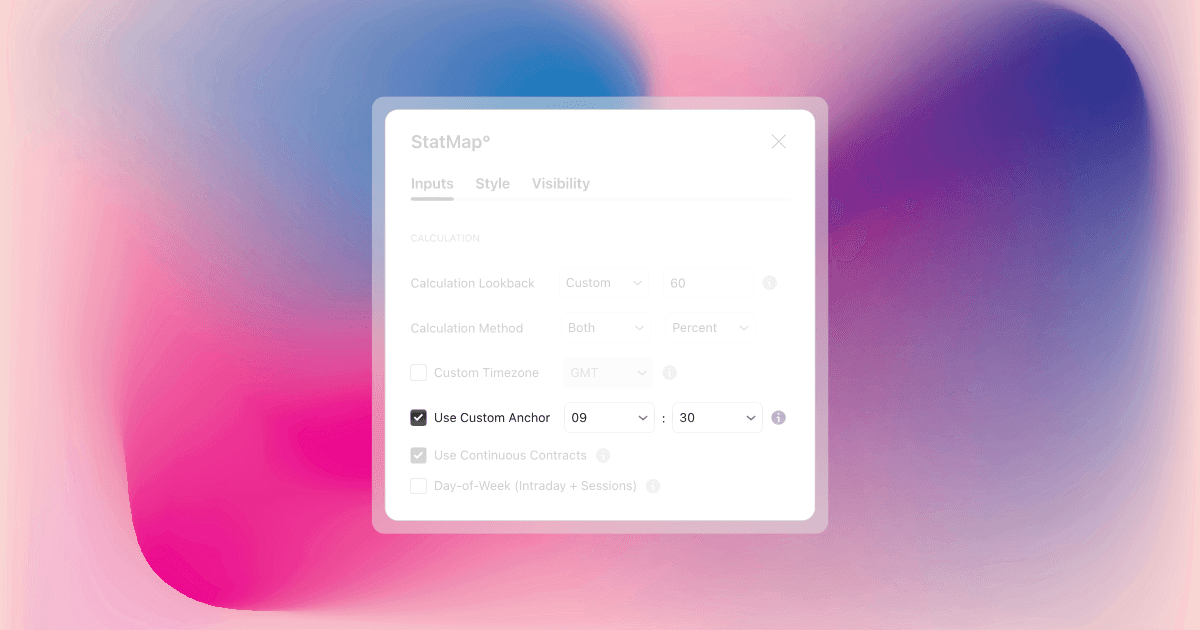
Custom Daily Anchor
Learn how to customize the daily anchor for your trading indicators to better align with your instrument's active session.
What is Statistical Mapping?
Statistical Mapping is a suite of statistical trading tools designed to help traders anticipate volatility and reversal points across any available timeframe and session on any ticker in TradingView....
What is Statistical Volatility?
Statistical Volatility is a dynamic tool designed to help traders identify periods of peak market activity and track the volatility characteristics of each candle throughout the day, week, or month....
StatMap V4: Major Update
Statistical Mapping and Statistical Volatility have received their most significant update yet. Version 4 brings unified workflows, enhanced flexibility, and powerful new features that make these tool...
Introducing Statistical Volatility 2.0 👀
Statistical Volatility 2.0 brings powerful new tools to StatMap, making market analysis sharper and more actionable. The new Volatility Filter lets you instantly highlight calm, trending, or highly ac...
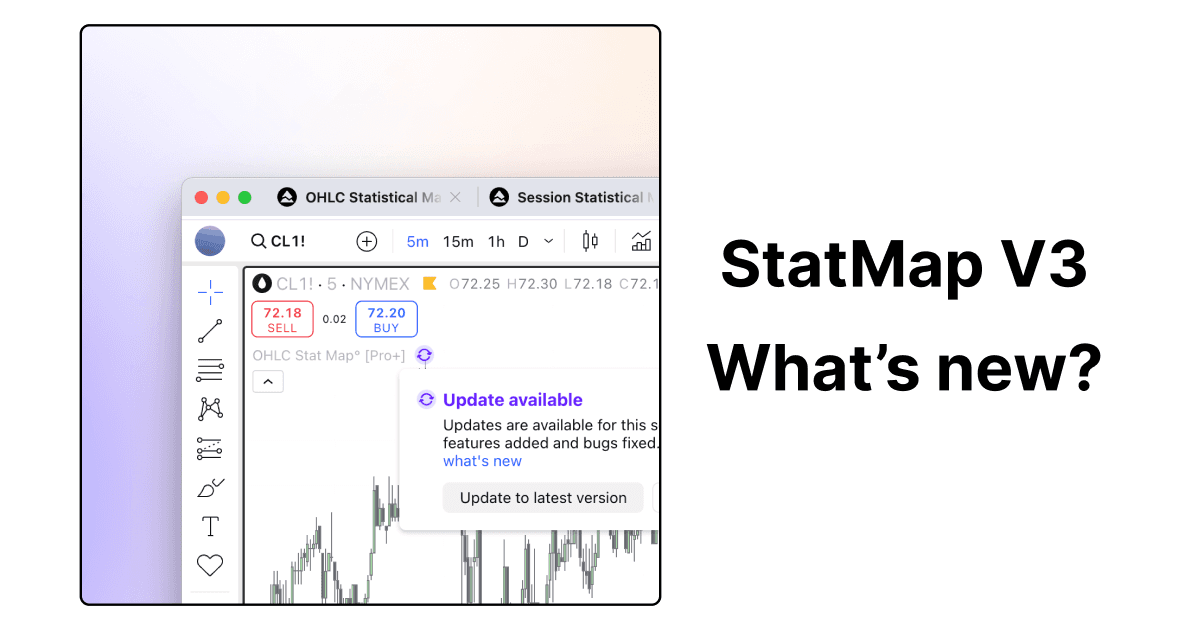
StatMap V3 – Update
New Script Update🚨 Midnight Levels are now consistent across all Timeframes! Dial in with Mean and Median Calculations – be confident about Current Contract levels, now backed by Historical Data....
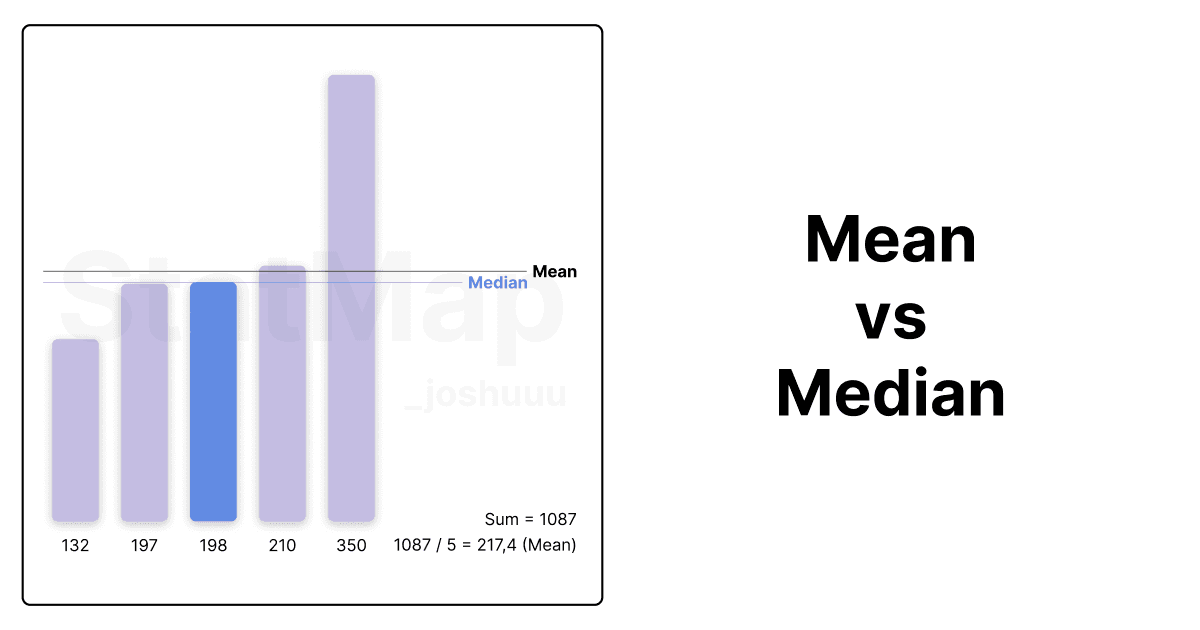
Difference Between Mean and Median in Trading Context
Understand the difference between Mean and Median when analyzing trading data. Learn when to use each metric and how outliers from news events like NFP or FOMC can skew your analysis.
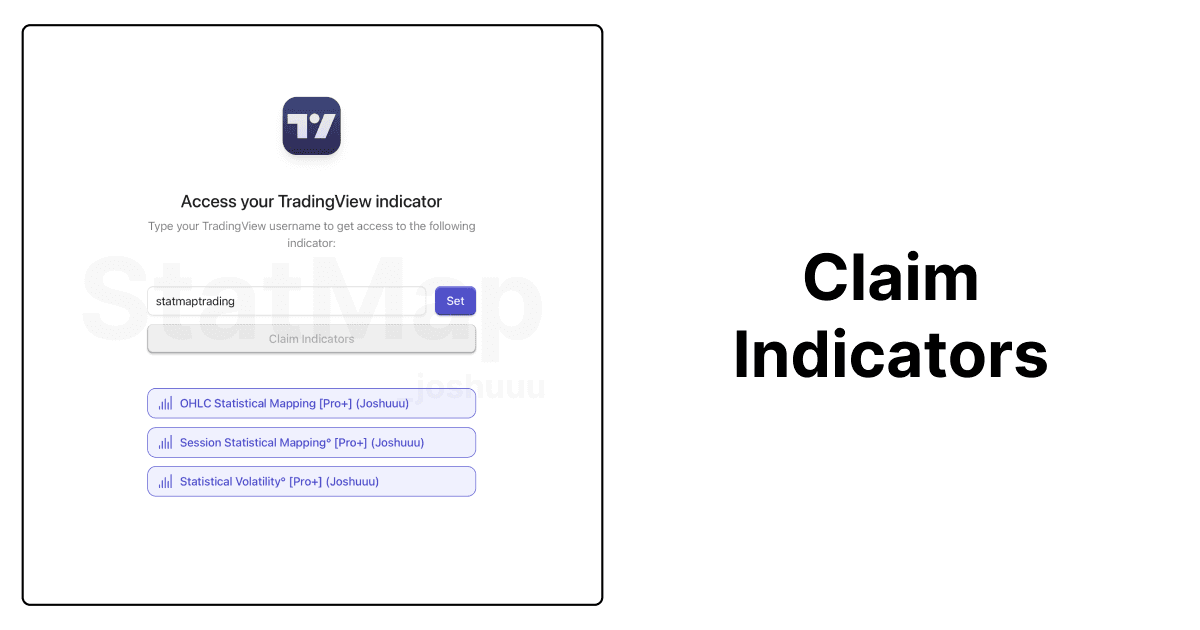
How to Claim Access to TradingView Indicators on Whop
Accessing your TradingView indicators via Whop is straightforward. Follow these simple steps to set up your indicators and start using them in TradingView. Below is a guide with visual instructions to...
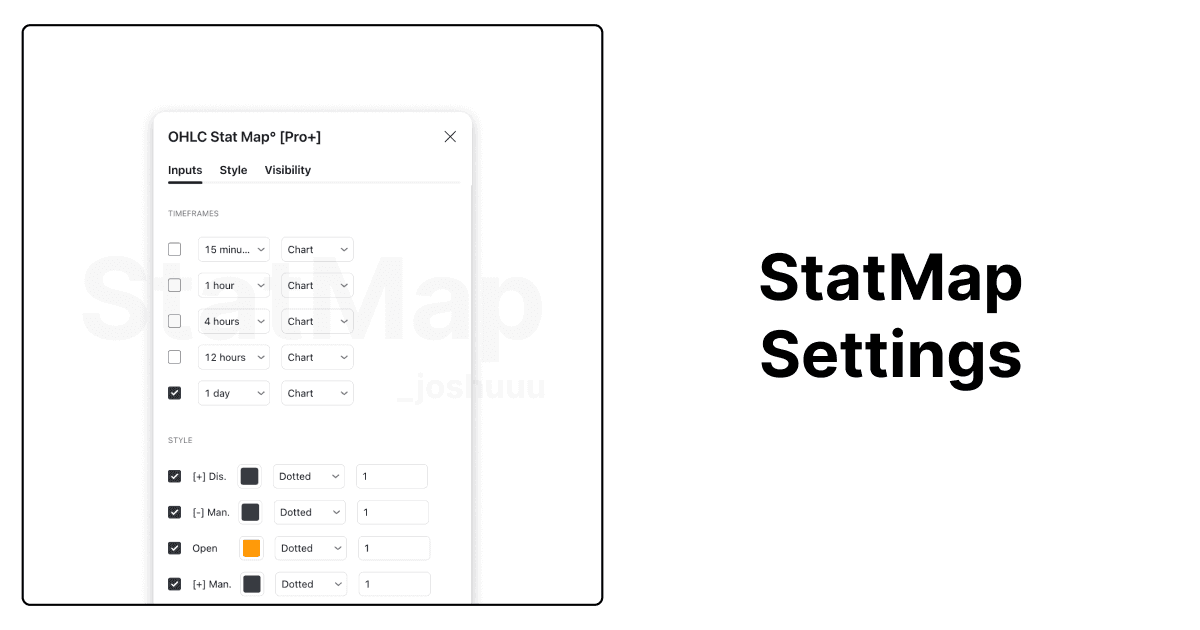
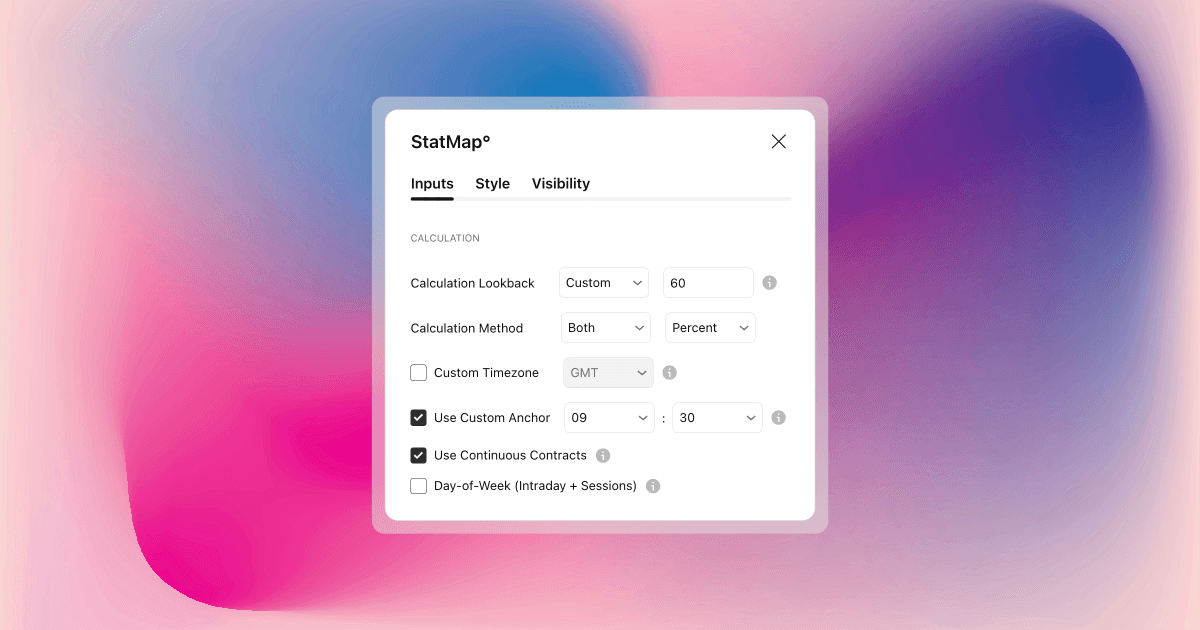
Settings
This post provides a detailed walkthrough of the Stat Map settings, explaining how to customize timeframes, styles, calculation parameters, and liquidity configurations. It highlights key features lik...
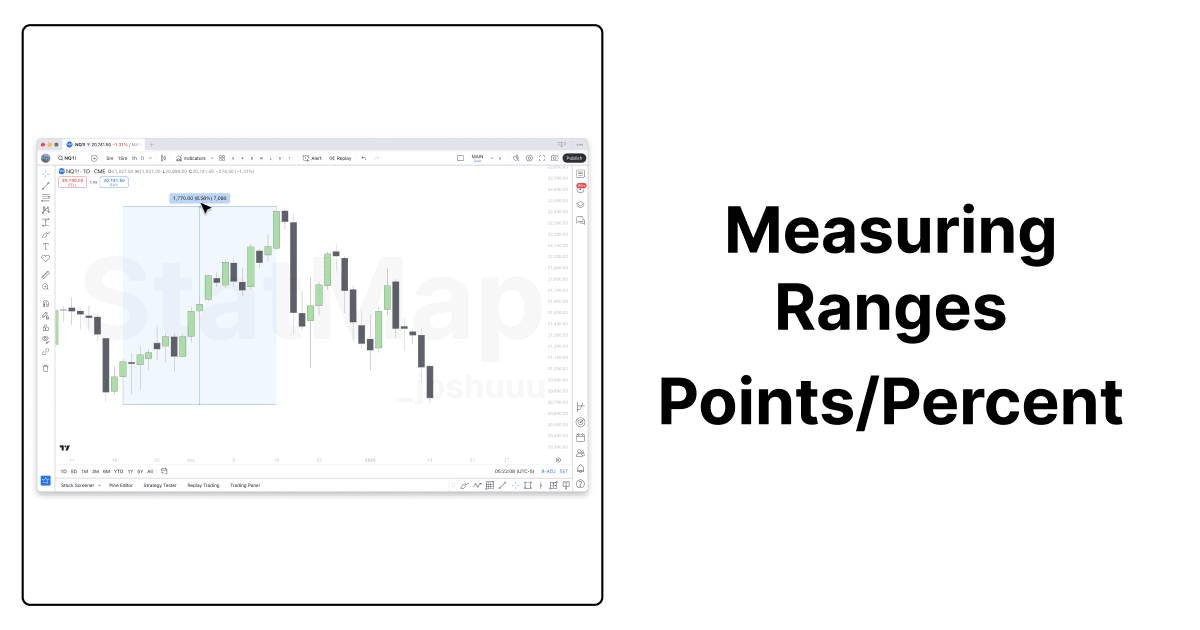
Measuring Ranges: Points or Percent?
When analyzing market movements, traders often measure price ranges to understand trends and volatility. The way these ranges are measured—either in points or percentages—can reveal unique insights ab...
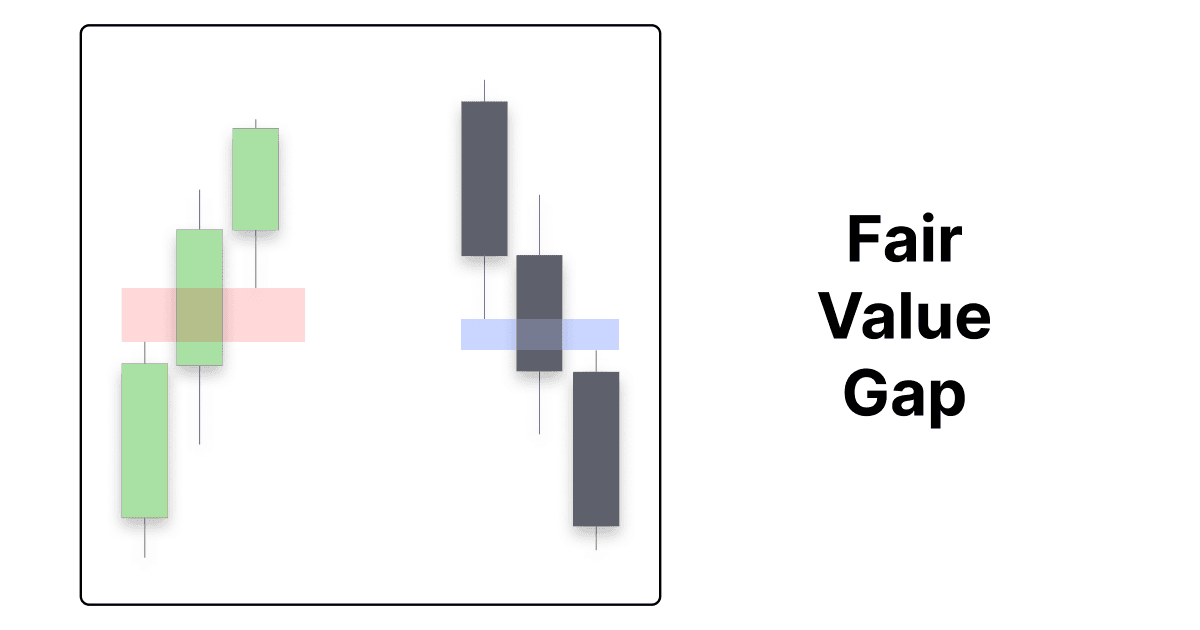
Fair Value Gaps
Fair Value Gaps are a simple yet powerful three-candle formation that can help you understand market intentions....
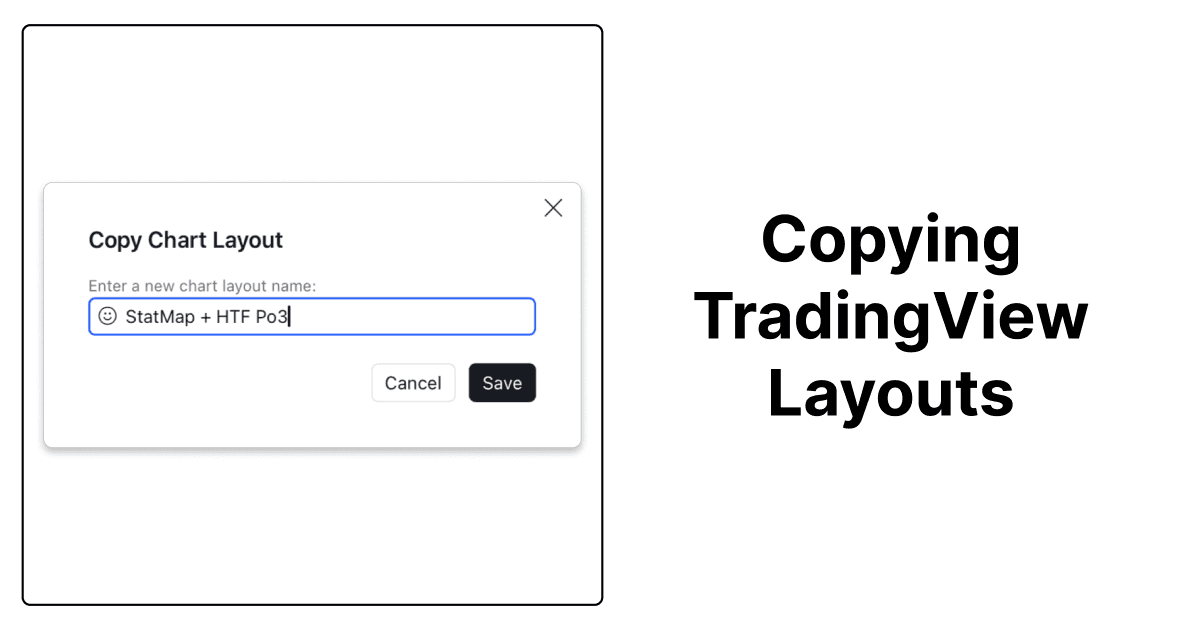
Copying TradingView Layouts
Sharing and duplicating TradingView layouts can save traders significant time and effort, especially when collaborating or adopting a proven setup. In this guide, we’ll walk you through how to copy a ...
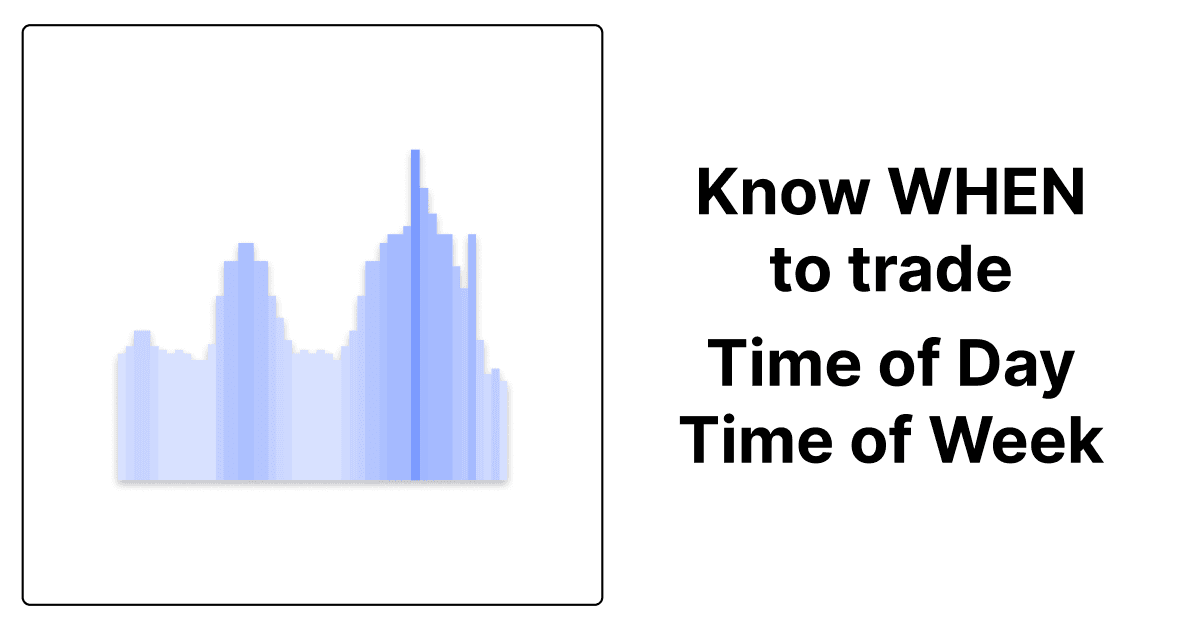
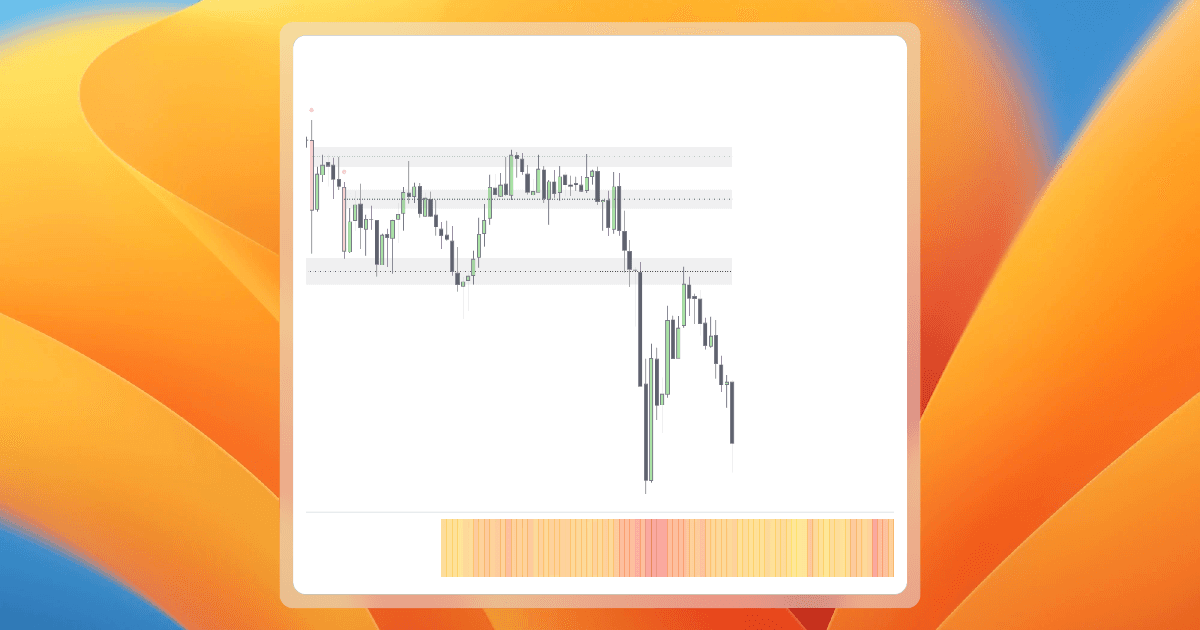
Using Statistical Volatility Indicators for Smarter Trading
Discover how Stat-Map’s Statistical Volatility Indicator helps traders identify high-volatility “Killzones,” refine timing, and optimize trading strategies....
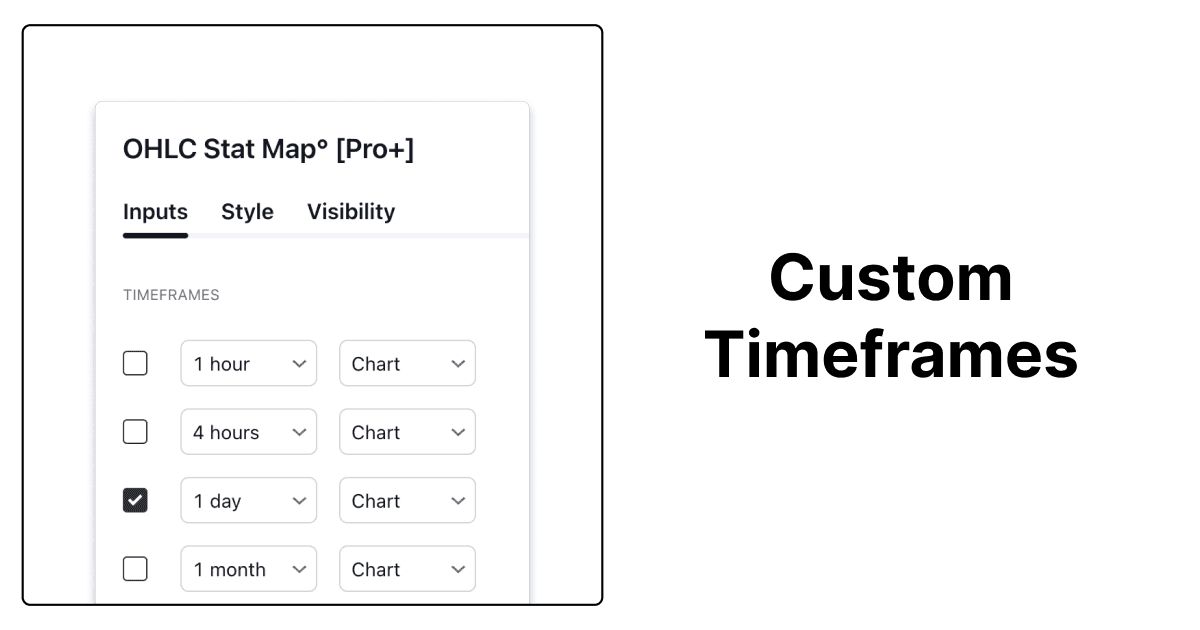
Custom Timeframes in Tradingview
TradingView is one of the most popular charting tools for traders worldwide, renowned for its flexibility and ease of use. While the default set of timeframes is quite comprehensive, there are times w...
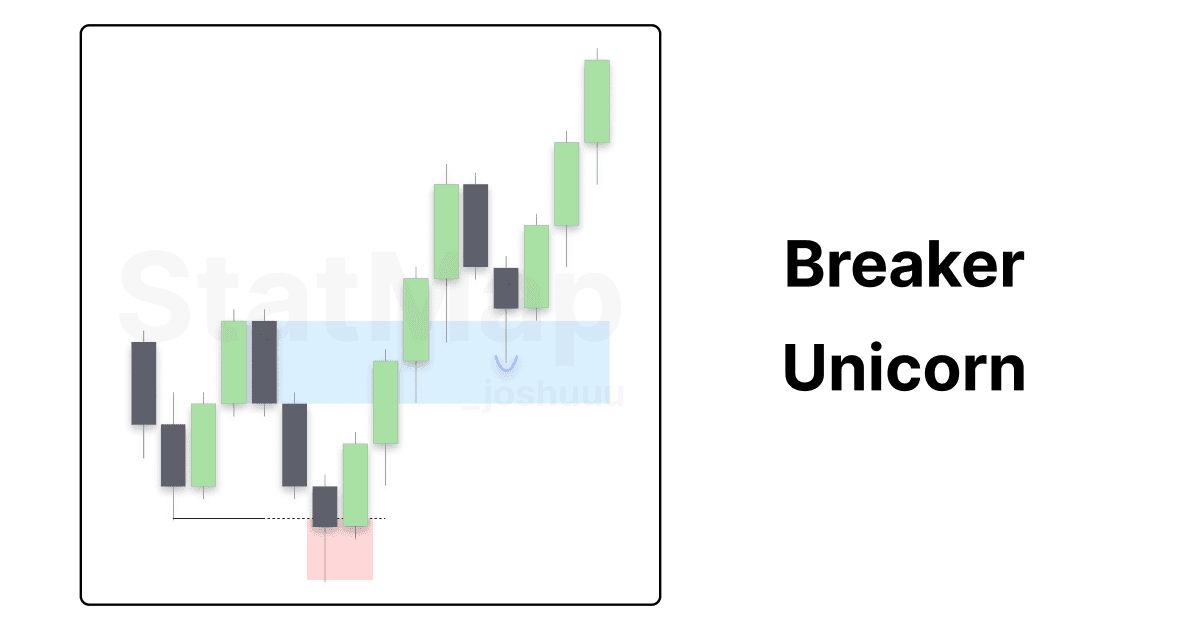
Understanding the Breaker/Unicorn Setup
The Breaker Block pattern is a powerful price action setup that captures liquidity before a reversal. Learn how it works, why it’s effective, and how to enhance it with Fair Value Gaps for higher prob...
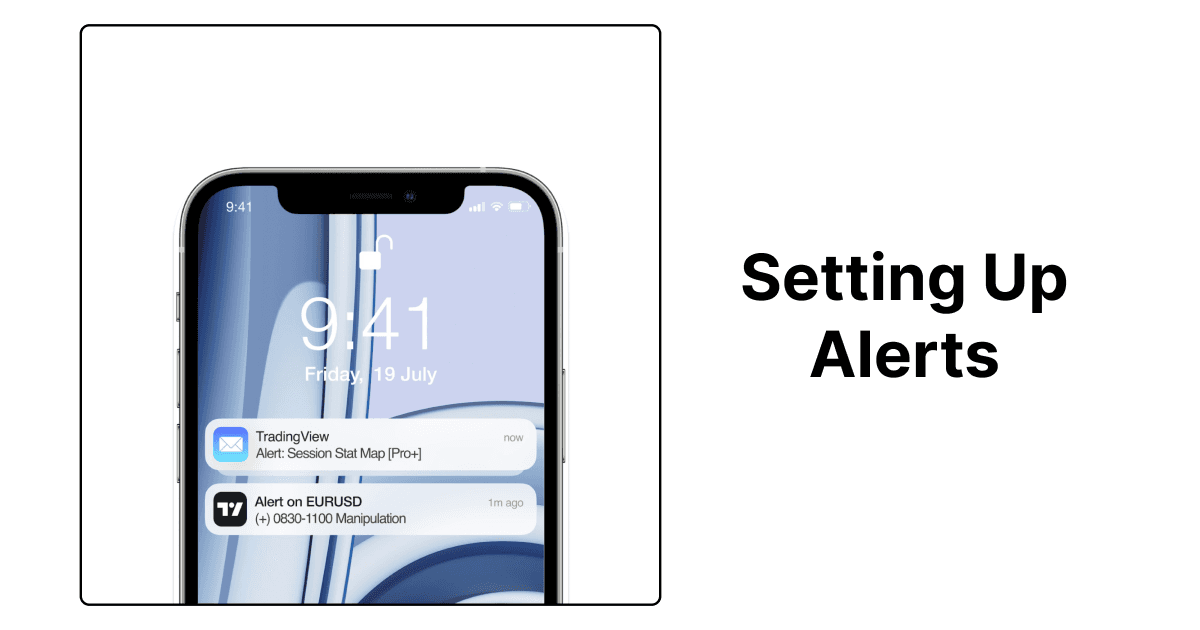
How to Set Up Alerts in TradingView
TradingView alerts are a powerful tool to stay updated on market movements without constantly watching the charts. Setting up alerts for your favorite indicators is surprisingly simple and can be done...
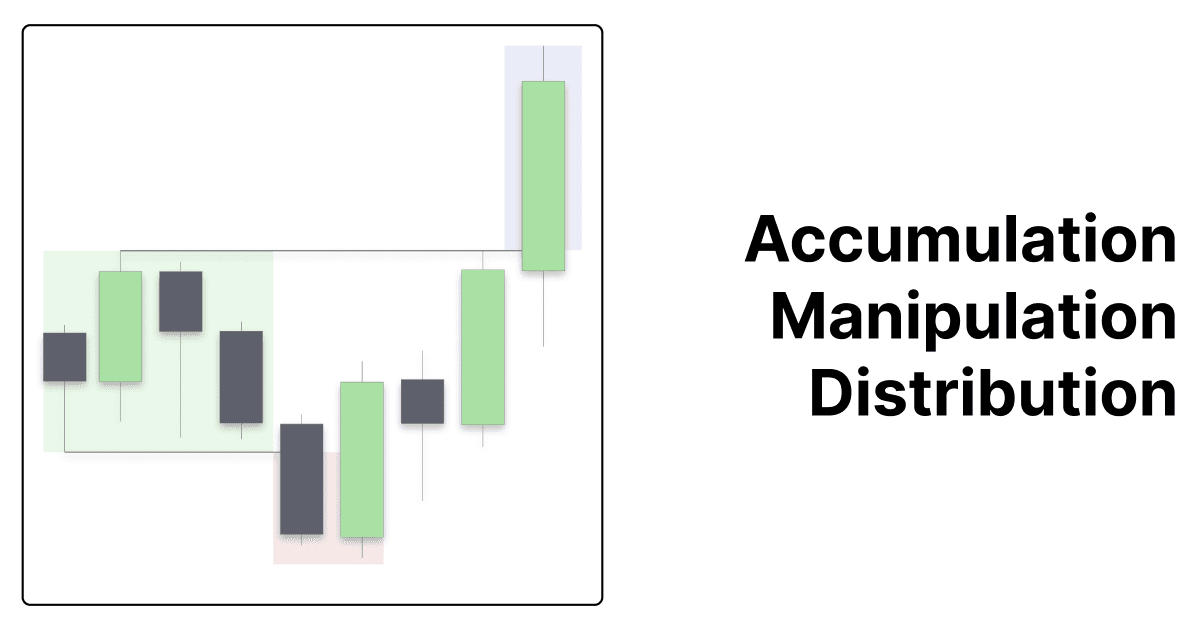
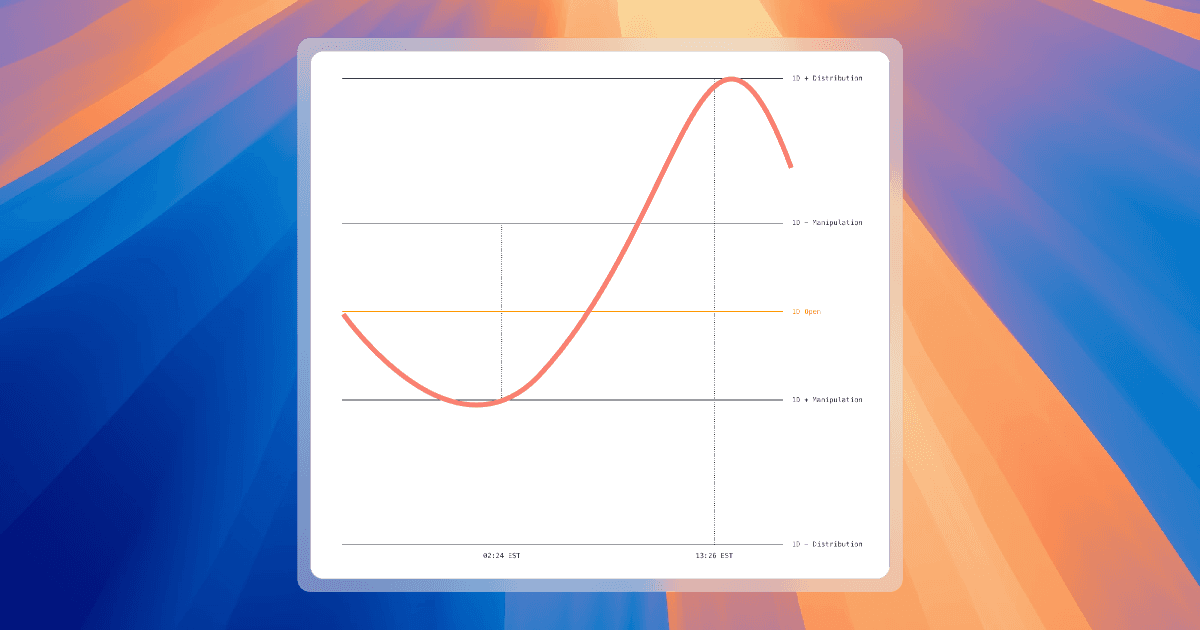
Understanding Accumulation, Manipulation, and Distribution in Trading
In the world of trading, price doesn’t simply move in one direction; it follows patterns and cycles that are often repeated. Understanding these patterns is key to developing a strong trading strategy...
New Features
Discover the latest updates, including customizable calculation methods and the ability to switch between points and pips for better precision. Tailor the indicators to fit your trading style....

What’s New in V2
A detailed overview of the new improvements in V2, including a historical lookback of up to 50 years, new chart options, and greater flexibility for traders. See how the latest updates can help stream...
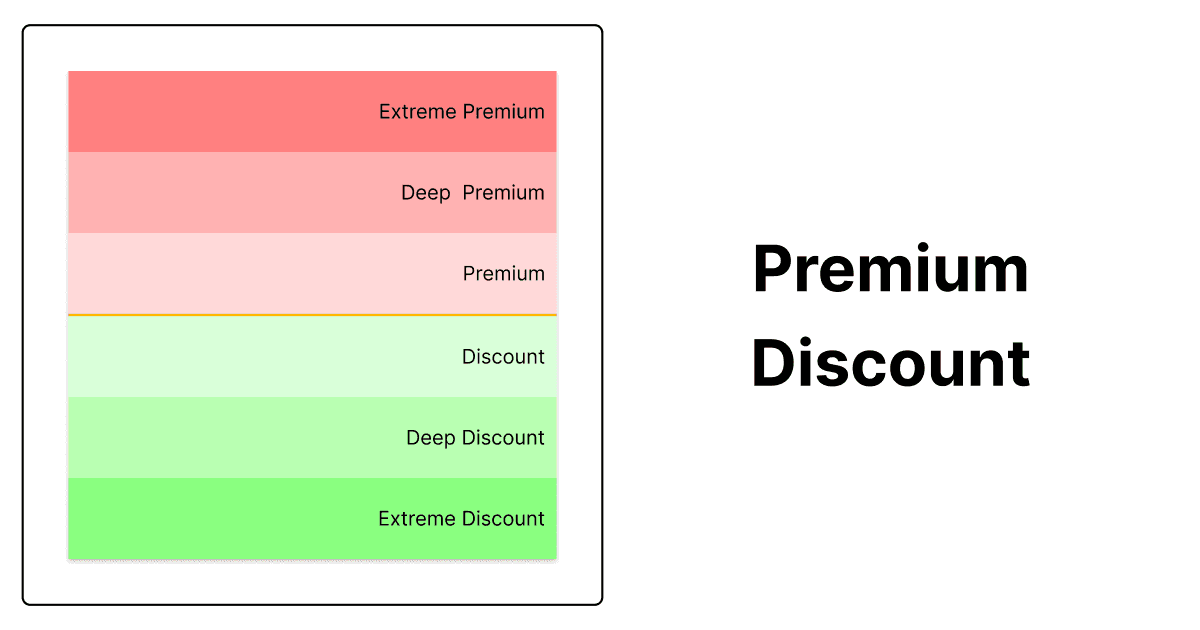
Premium-Discount
Master the concept of premium and discount zones to identify potential price reversal points. Learn how these levels can help you understand areas where price is heavily overbought or oversold....
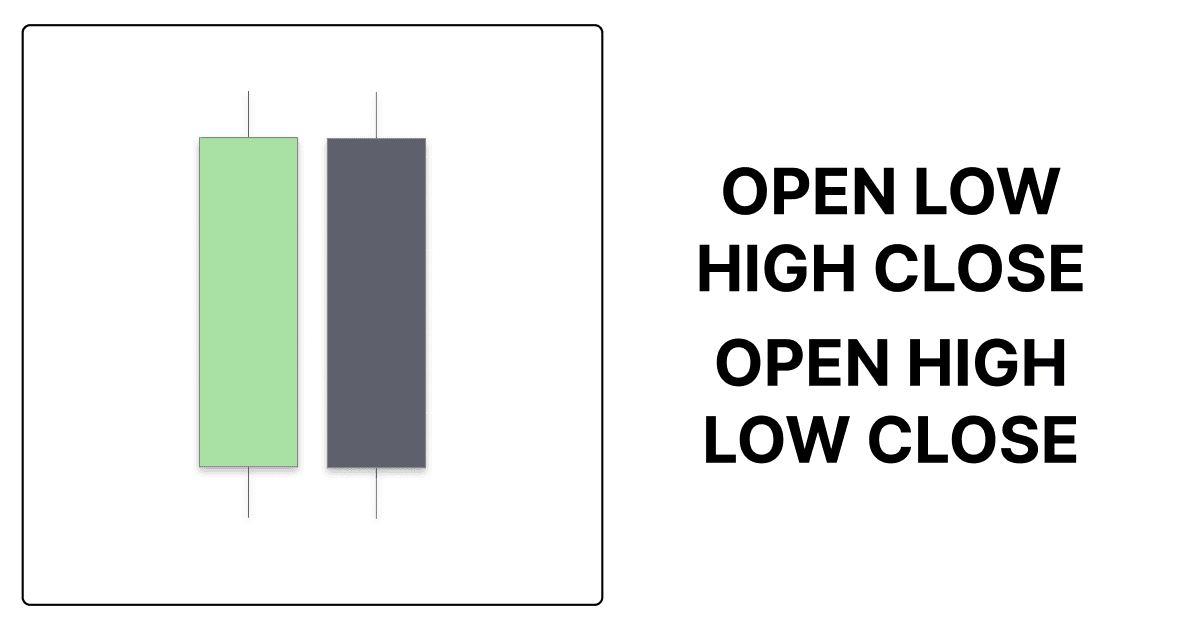
OHLC/OLHC – The Foundation of Price Action
In trading, understanding how price moves throughout a session is crucial for making informed decisions. A key tool that helps traders visualize these movements is the OHLC (Open, High, Low, Close) ch...