StatMap V4: Major Update
What's New in Statistical Mapping V4
Statistical Mapping V4 represents a complete evolution of how traders interact with statistical price projections with big updates to Statistical Mapping and Statistical Volatility.
Unified Interface
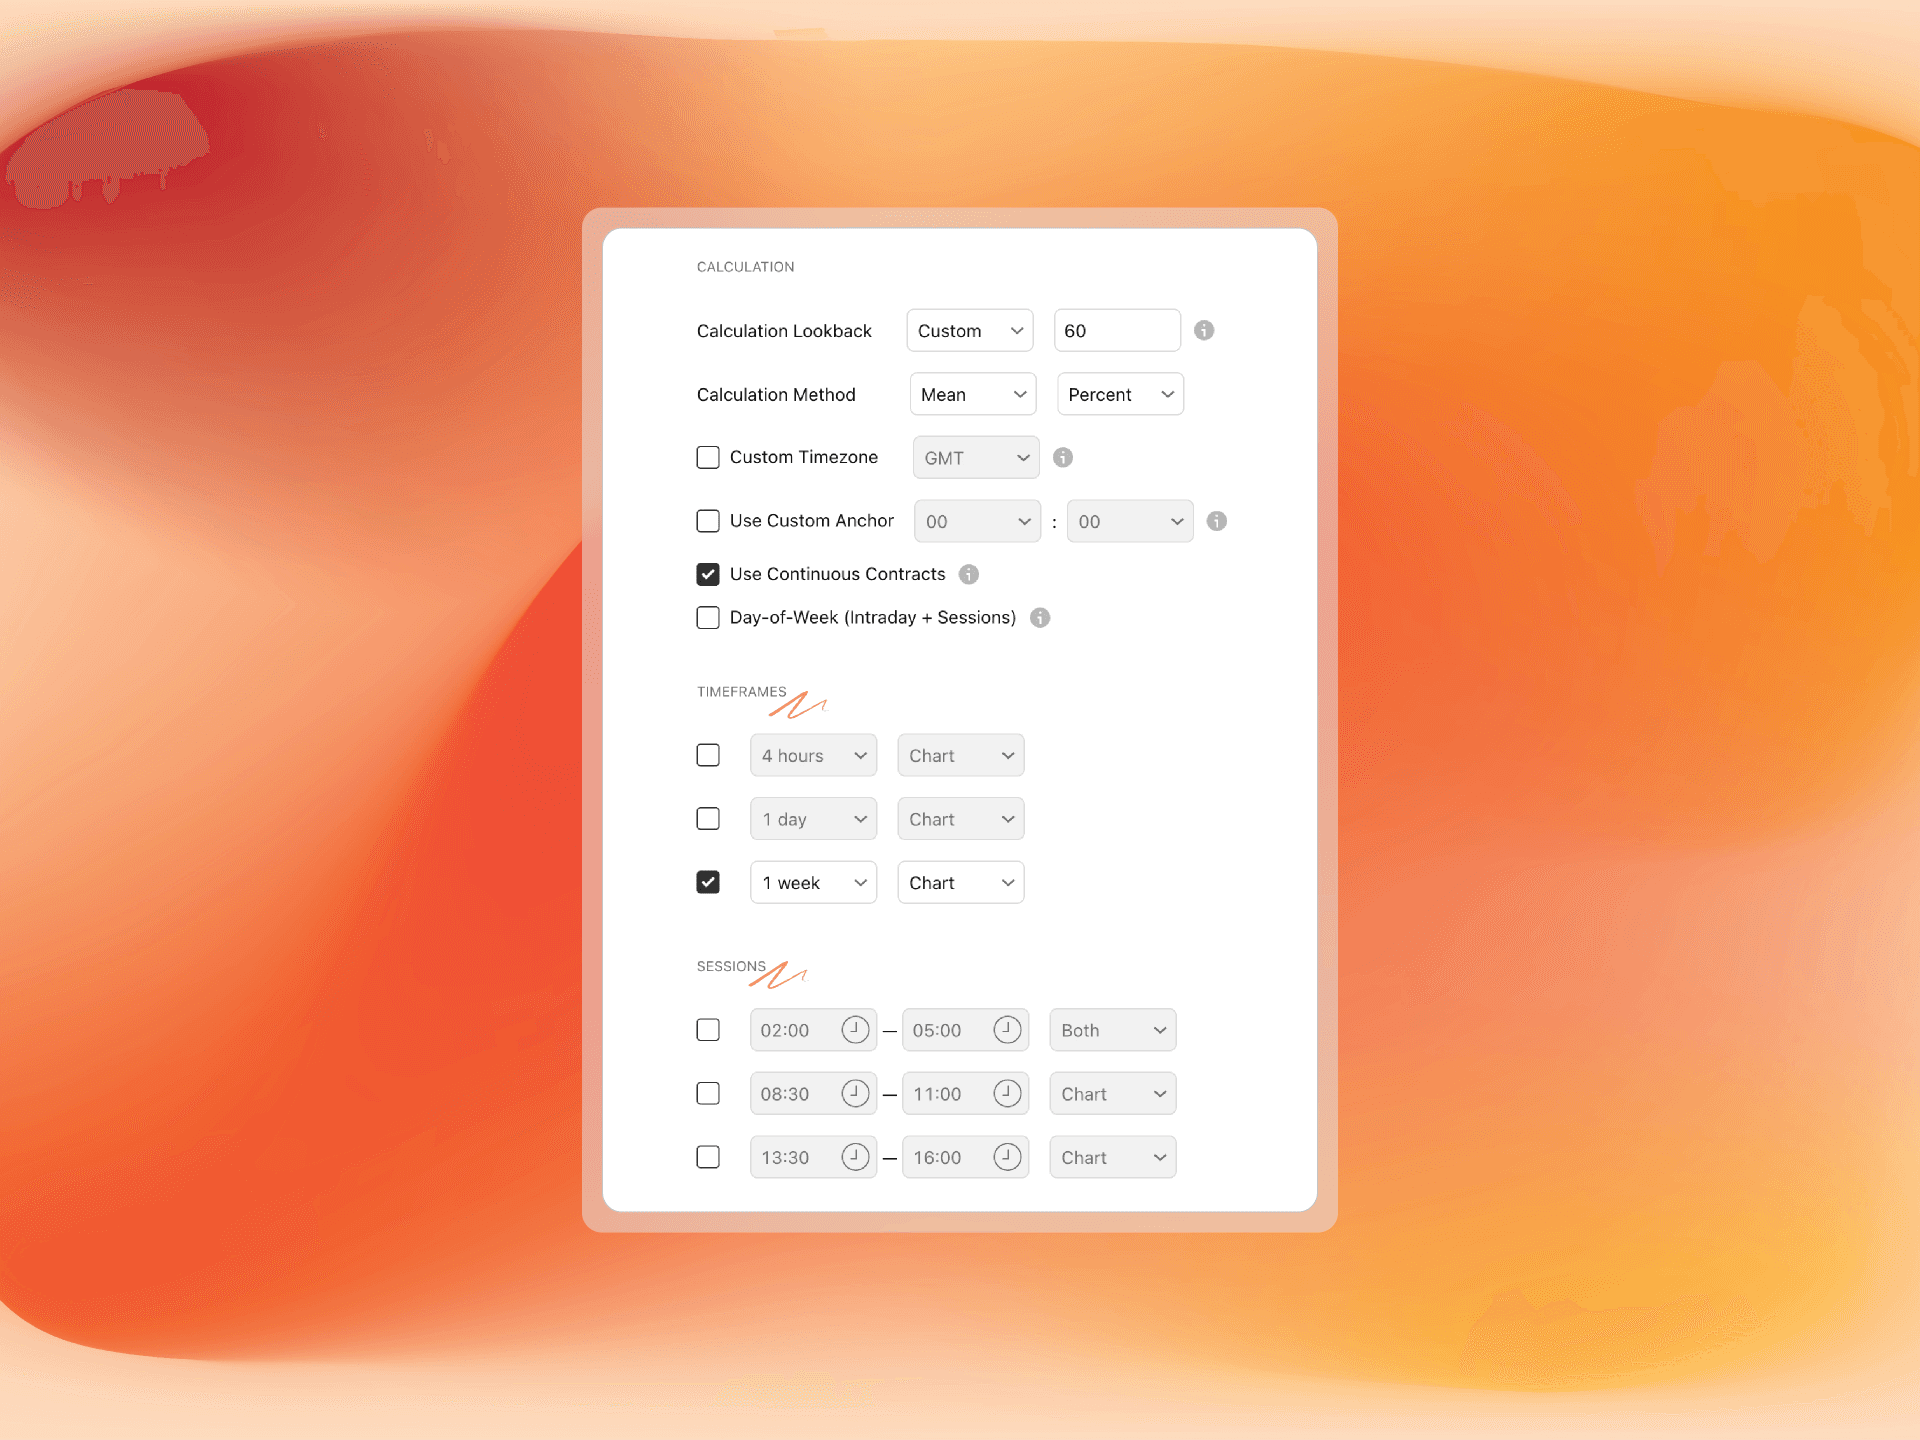
The most transformative change in V4 is the unification of OHLC and Session StatMaps into a single powerful script. Previously, traders needed to switch between separate indicators depending on whether they were analyzing standard timeframes or custom sessions. Now everything exists in one place with a cleaner, more intuitive setup supporting 3 timeframes plus 3 custom sessions simultaneously.
This consolidation eliminates the complexity of managing multiple indicators and ensures consistency across all analysis types.
Custom Daily Anchors
Traders can now define their own daily session start time instead of being locked to midnight. This feature is perfect for markets that have significant openings that don't align with midnight, such as the NYSE opening bell at 09:30 or the London market open at 08:00.
The custom anchor works seamlessly with any timezone, ensuring that daily statistics accurately reflect actual trading behavior rather than arbitrary time boundaries.
Click here for more information
Day-of-Week Intelligence
V4 introduces the ability to aggregate statistics by weekday. Instead of treating all 10:00 bars the same regardless of day, the indicator can now separate Monday behavior from Friday behavior at the same time.
This feature is especially valuable for intraday timeframes and custom sessions, where specific days often exhibit distinctly different characteristics. For instance, Monday morning volatility patterns frequently differ significantly from Friday afternoon behavior.
Display Mode Control
The new display mode setting allows traders to toggle between StatMap Levels, Liquidity Levels, or Both. This decluttering feature helps focus analysis on what matters most at any given moment without removing features from the chart entirely.
Enhanced Liquidity Detection
Liquidity analysis has been significantly improved with several key enhancements:
Time window controls to focus on recent liquidity points
Threshold windows around levels for visual guidance
More precise liquidity-to-level matching algorithms
These improvements make it easier to identify where significant stop loss orders accumulate and track when institutional traders hunt these liquidity pools.
Smarter Tooltips and Consistent Levels
Tooltips now display calculation method, unit, and sample size, providing better context for each projected level. Additionally, levels remain consistent across different chart timeframes and sessions, eliminating discrepancies that previously occurred when switching between timeframes.
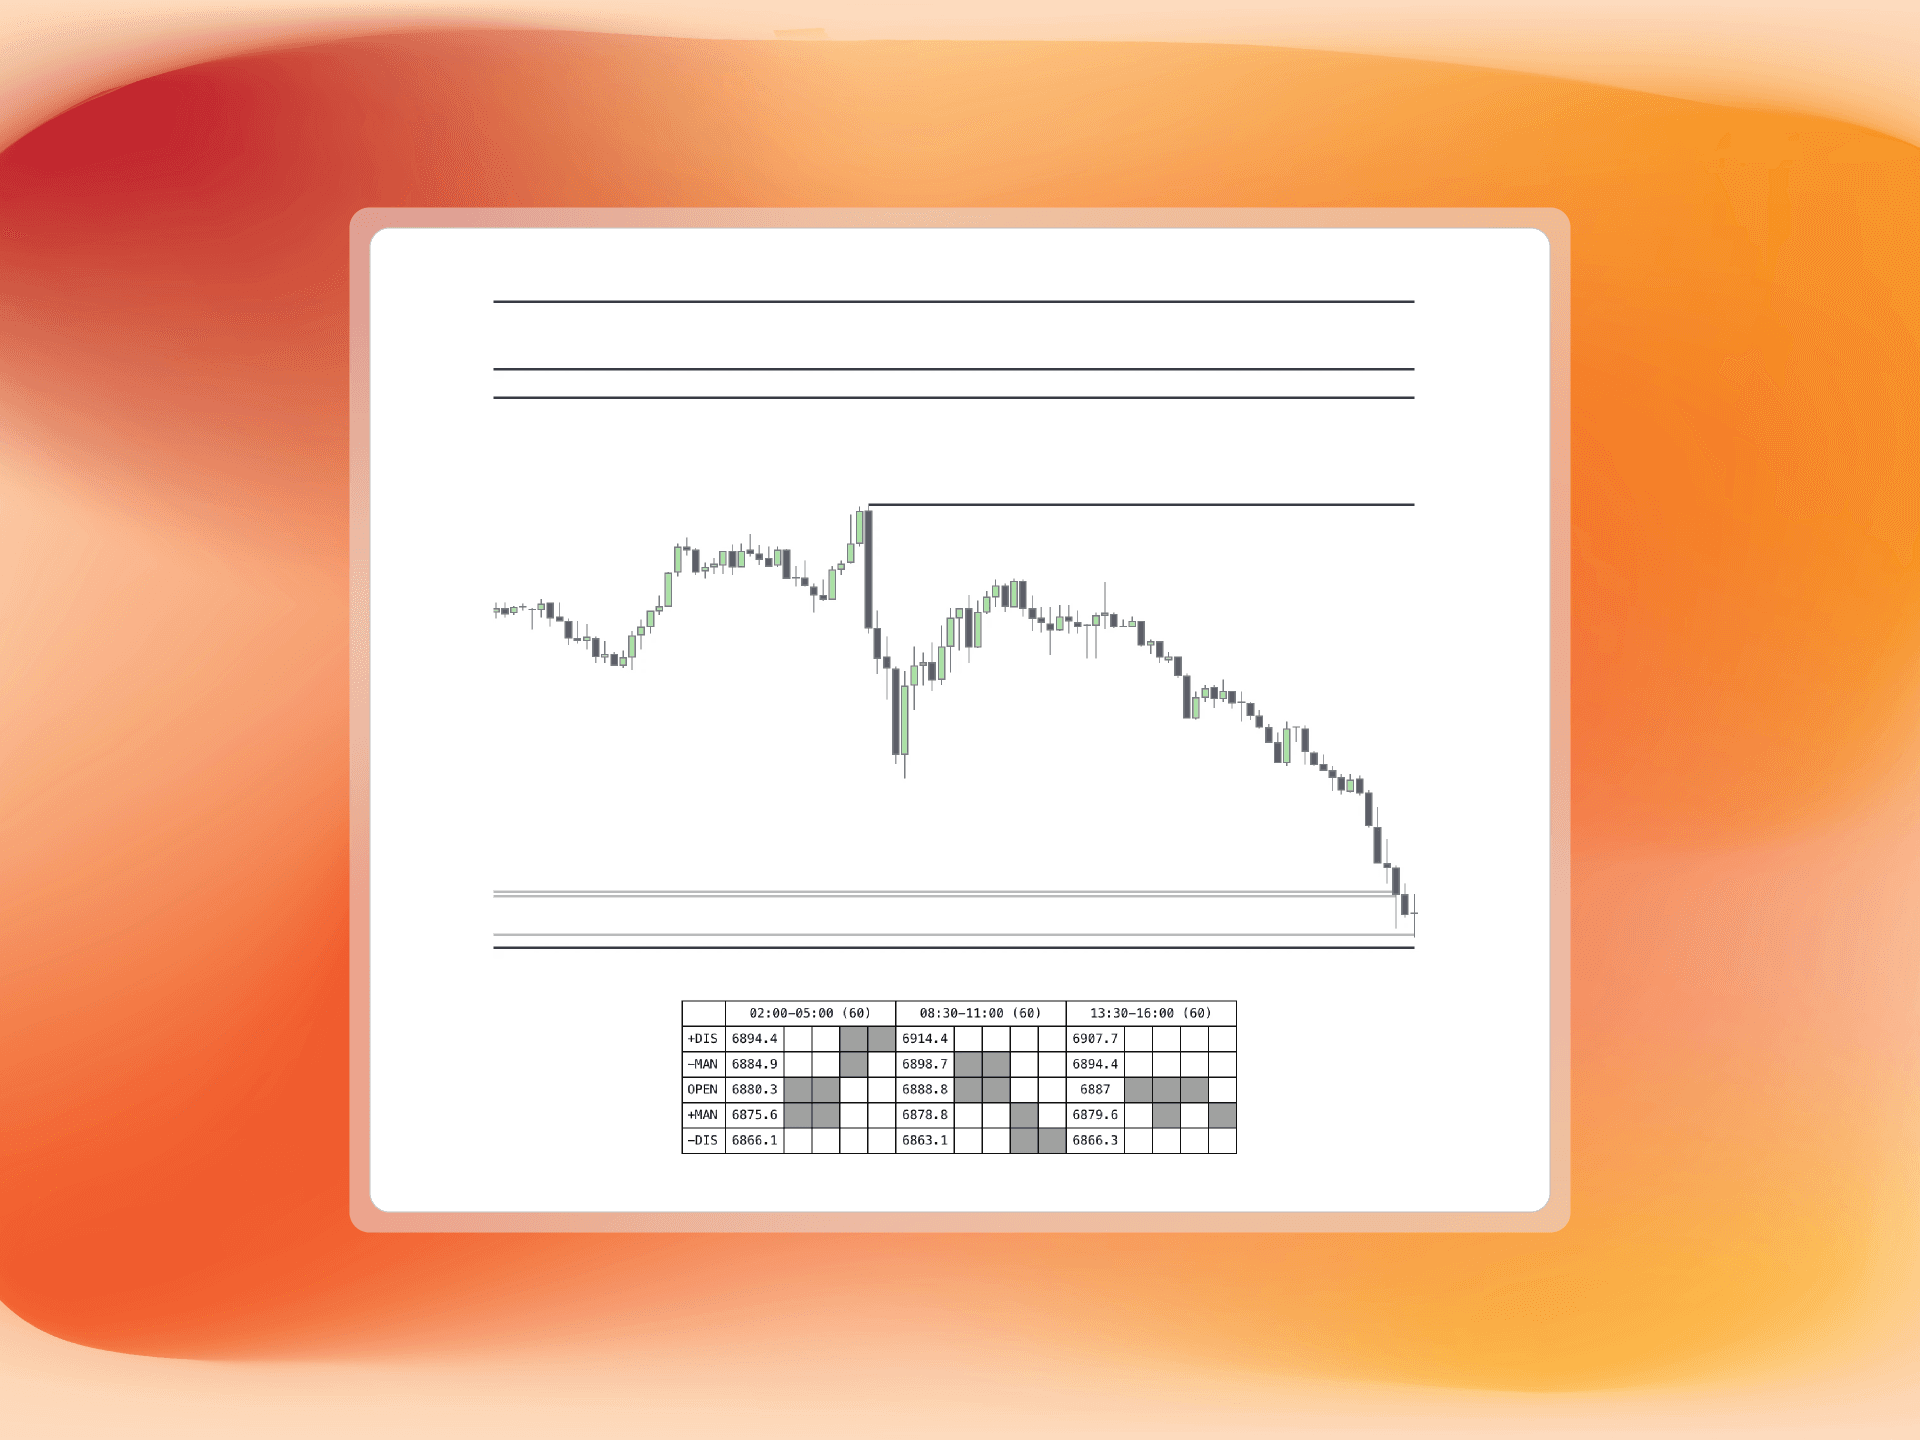
Quarterly Table for Sessions
Custom sessions now include the detailed quarterly table view that was previously only available for standard timeframes. This addition allows traders to track which quarter of their session touched each level, providing valuable timing insights.
What's New in Statistical Volatility V4
Statistical Volatility V4 brings unprecedented flexibility and a comprehensive alert system that tracks displacement events throughout their entire lifecycle.
Flexible Timeframes
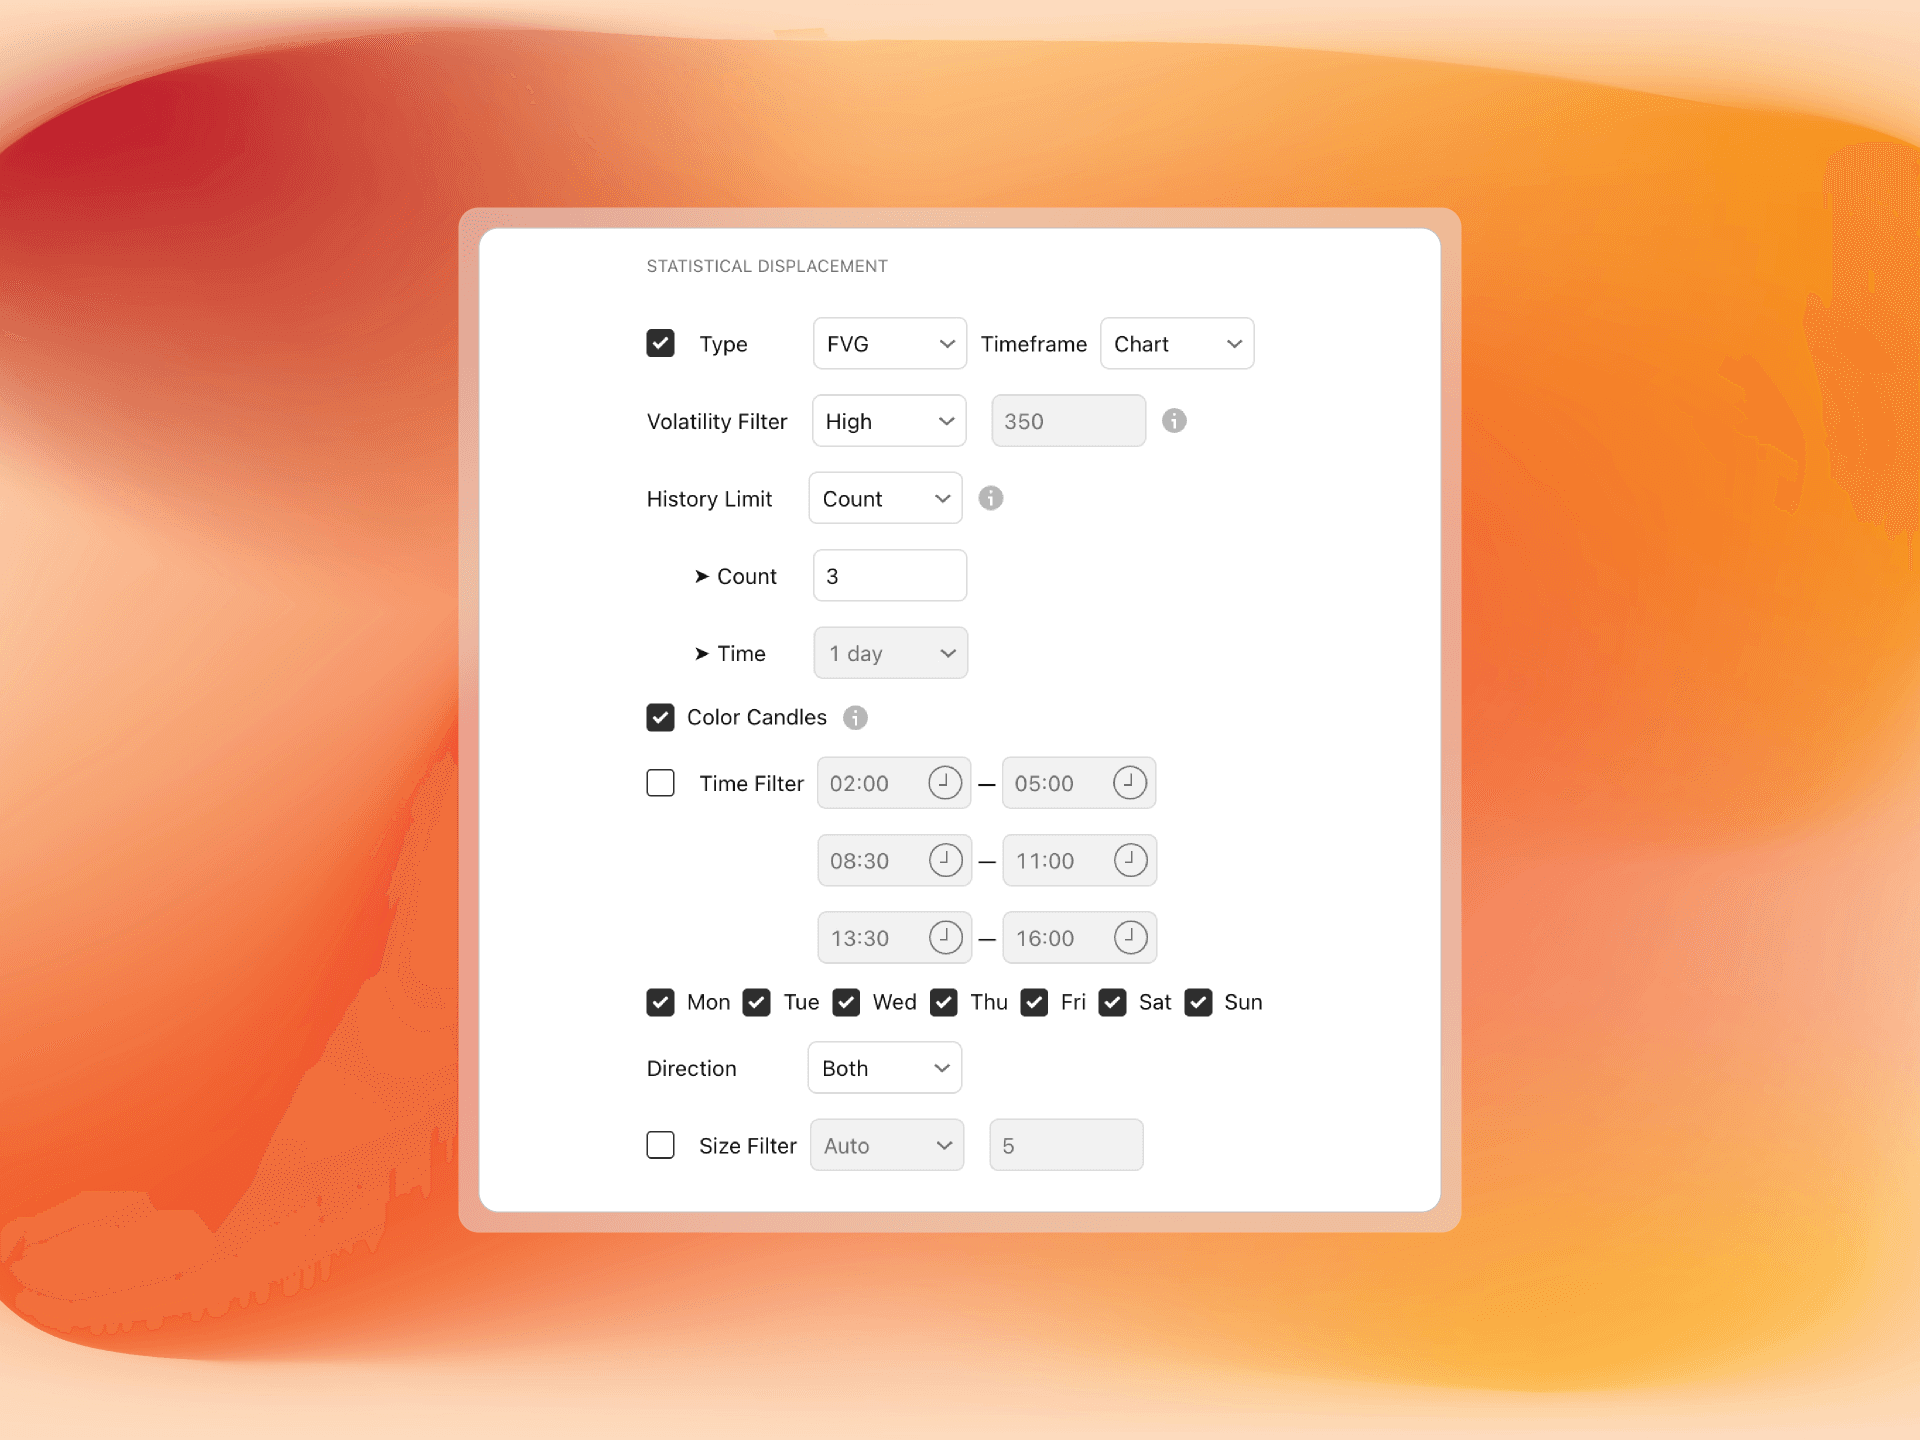
The most significant enhancement is the ability to detect displacements on any timeframe, not just the chart timeframe. Traders can now analyze displacement events across multiple timeframes simultaneously, viewing higher timeframe displacements on lower timeframe charts for better context.
This capability transforms how traders understand volatility structure across different time horizons.
History Management
V4 introduces two distinct modes for managing displacement history:
Count Mode: Keep the last N displacement ranges on the chart
Time Mode: Keep all ranges within a specific time window (such as the last 24 hours)
This flexibility provides better control over chart clutter while ensuring relevant displacement information remains visible.
Advanced Candle Coloring
The new option to force chart timeframe colors when viewing higher timeframe displacements provides more intuitive visual feedback. This feature maintains granular candle coloring on lower timeframes while analyzing higher timeframe displacement structure.
Improved Graph Pane and Table Display
The graph pane now includes reference lines at 0.00, 0.33, 0.66, and 1.00 for quick visual assessment of relative volatility levels. The enhanced table display shows the last 3 displacement events with time labels that automatically adapt to the selected timeframe.
Advanced Alerts: Complete Displacement Lifecycle Monitoring
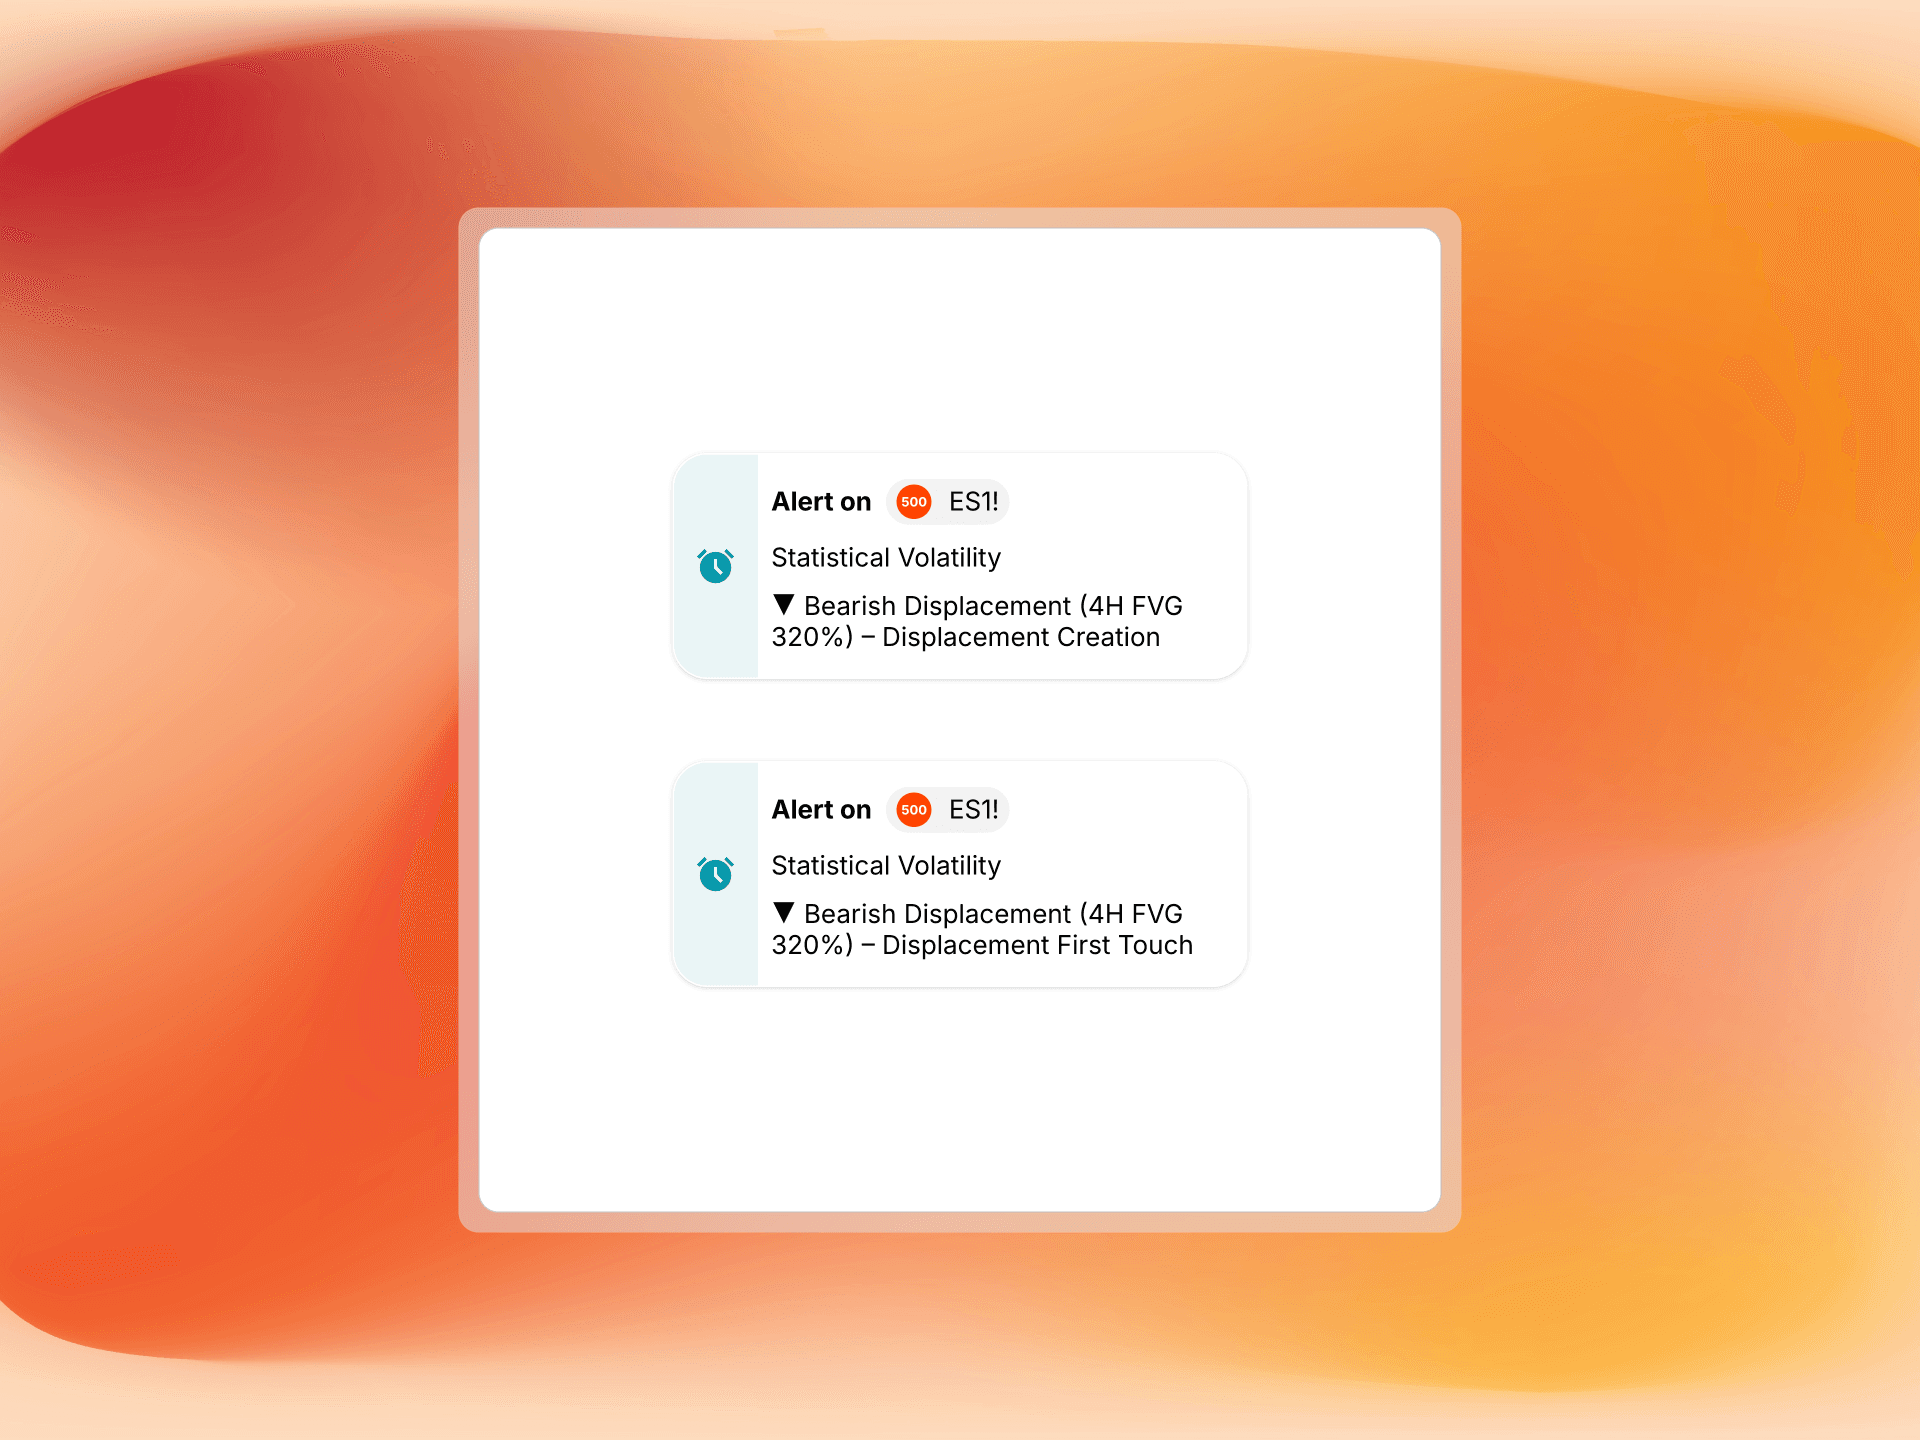
Statistical Volatility V4 introduces a comprehensive alert system that tracks displacement events throughout their entire lifecycle with three distinct alert types:
Creation Alert: Fires when a new displacement is detected in real-time.
First Touch Alert: Triggers on the first boundary touch of the displacement range.
Midpoint Touch Alert: Fires when price touches the 50% retracement level of the displacement range.
Each alert uses one-shot logic with state tracking, preventing alert spam while maintaining comprehensive coverage. Alerts include detailed contextual information such as direction indicators, displacement details, and symbol ticker.
By default, Creation and First Touch alerts are enabled. Traders using mean reversion strategies can enable Midpoint Touch alerts for complete lifecycle monitoring.
Practical Applications
The V4 updates unlock new trading approaches:
Multi-Timeframe Context: View higher timeframe displacements on lower timeframe charts while maintaining Statistical Mapping levels from multiple timeframes, creating a complete picture of market structure.
Session-Specific Analysis: Use custom anchors and day-of-week intelligence to analyze exactly how your specific market behaves during the periods you trade.
Lifecycle Trading: Track displacement events from creation through boundary tests to midpoint retracements, identifying opportunities at each phase.
Focused Analysis: Toggle display modes to concentrate on liquidity during hunt phases, then switch to projection levels for target identification.
Getting Started with V4
For existing users, V4 will automatically update in TradingView. The unified interface means you'll now find both timeframe and session controls in a single indicator.
New users should start with the default settings and gradually layer in advanced features like day-of-week bucketing, custom anchors, and multi-timeframe displacement analysis as they become comfortable with the core functionality.
For detailed configuration guidance, refer to the complete Settings & Features documentation.
Related Articles
Introducing Statistical Volatility 2.0 👀
Statistical Volatility 2.0 brings powerful new tools to StatMap, making market analysis sharper and more actionable. The new Volatility Filter lets you instantly highlight calm, trending, or highly ac...
StatMap V3 – Update
New Script Update🚨 Midnight Levels are now consistent across all Timeframes! Dial in with Mean and Median Calculations – be confident about Current Contract levels, now backed by Historical Data....