Introducing Statistical Volatility 2.0 👀
Statistical Volatility 2.0 brings powerful new tools to StatMap, making market analysis sharper and more actionable. The new Volatility Filter lets you instantly highlight calm, trending, or highly active market phases for better trade timing. The update also introduces Statistical Displacements—identifying explosive price moves tied to institutional activity and helping you spot true market momentum, not just noise. Plus, customizable settings give you precise control to match your trading style.
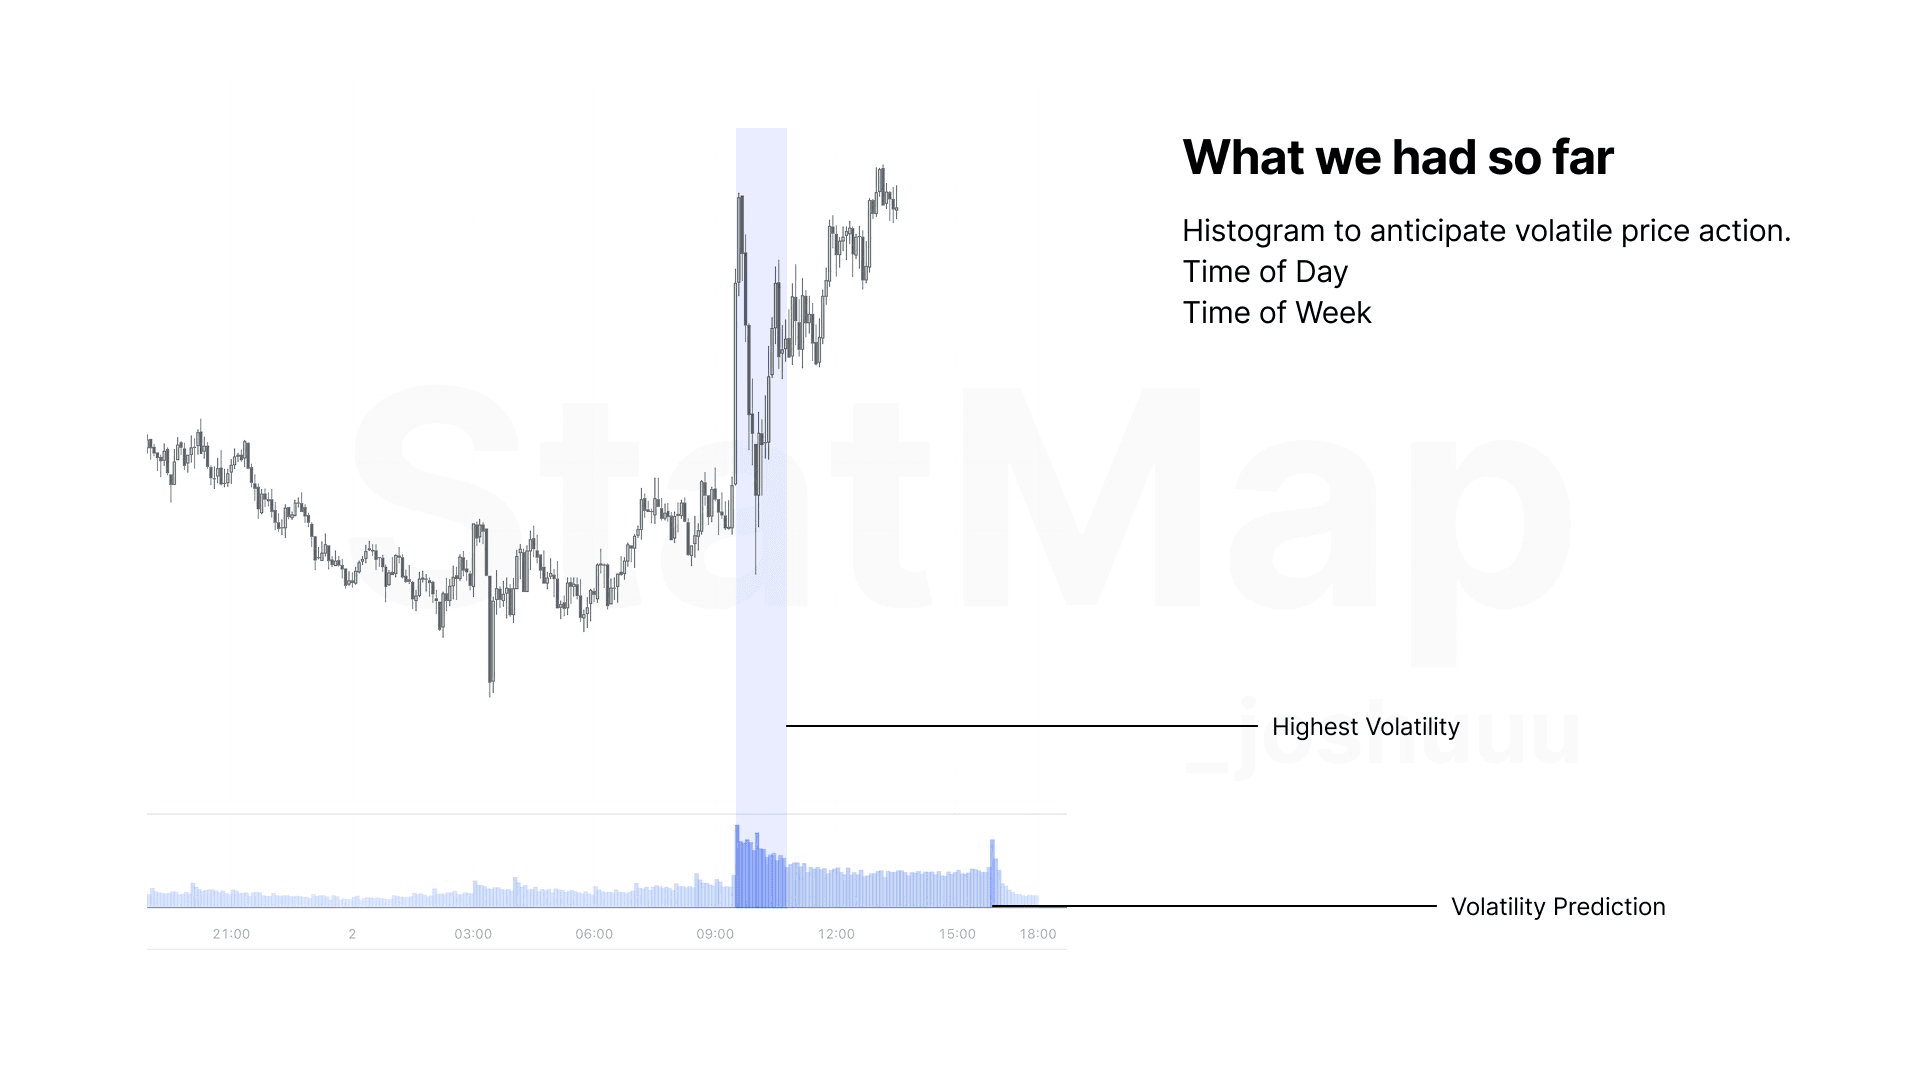
Tracking Market Volatility Made Easy
So far, StatMap's Statistical Volatility tool has helped traders monitor market moves by visualizing and tracking volatile times
New Filtering Features
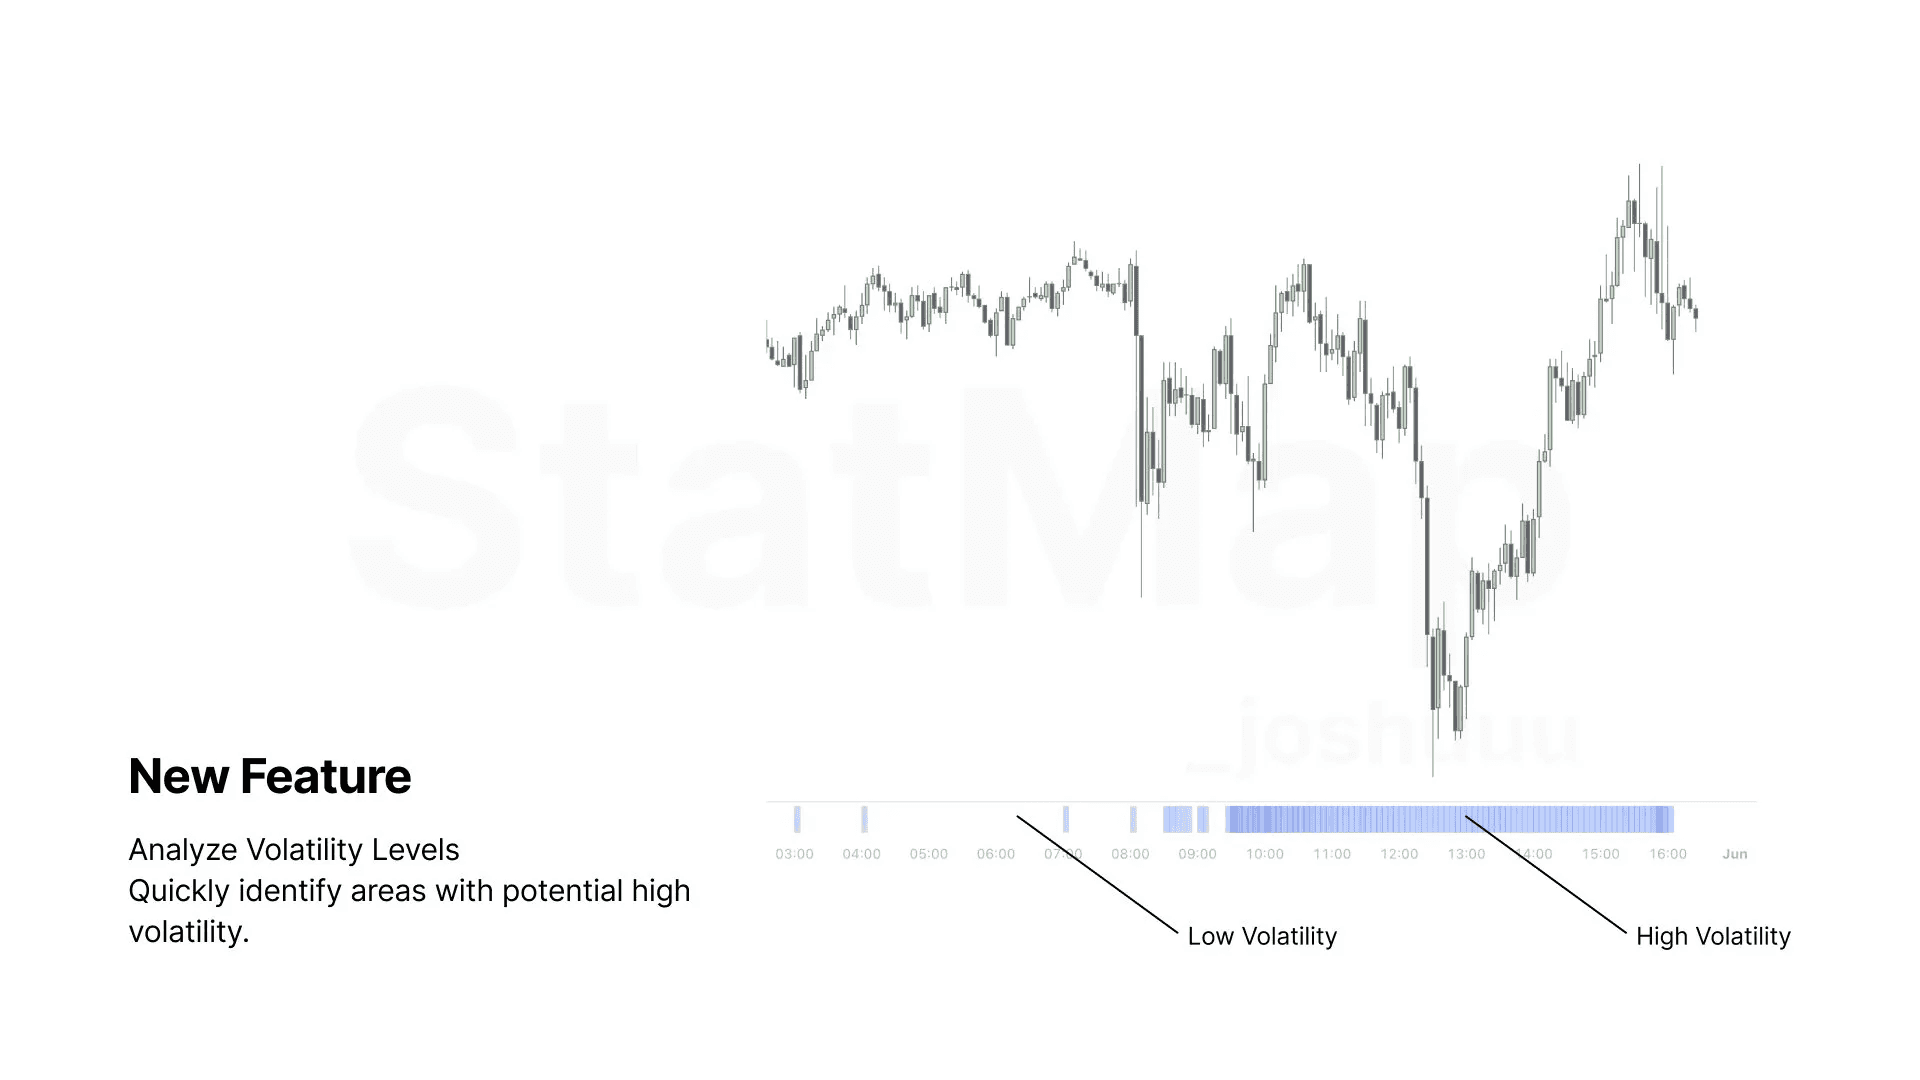
What Is the Volatility Filter?
The Volatility Filter segments market activity based on how dynamic price movements are. It helps traders distinguish between low-activity consolidation and high-energy breakouts or trend phases. Filter Settings Explained:
Low (Default): Displays all ranges, offering a complete view of price action.
Medium: Filters out calmer zones, showing only ranges more volatile than 33% of the min-max volatility window.
High: Focuses exclusively on the most active market segments—zones with volatility greater than 66% of the historical range.
When to Use It:
Use “Medium” or “High” when you’re preparing for breakout trades or seeking active setups. “Low” works best for broader trend analysis or identifying buildup zones before potential moves.
Real Example:
Imagine you’re scanning for intraday plays. Switch to “High” volatility to instantly highlight only the hottest parts of the day—perfect for breakout or momentum strategies.
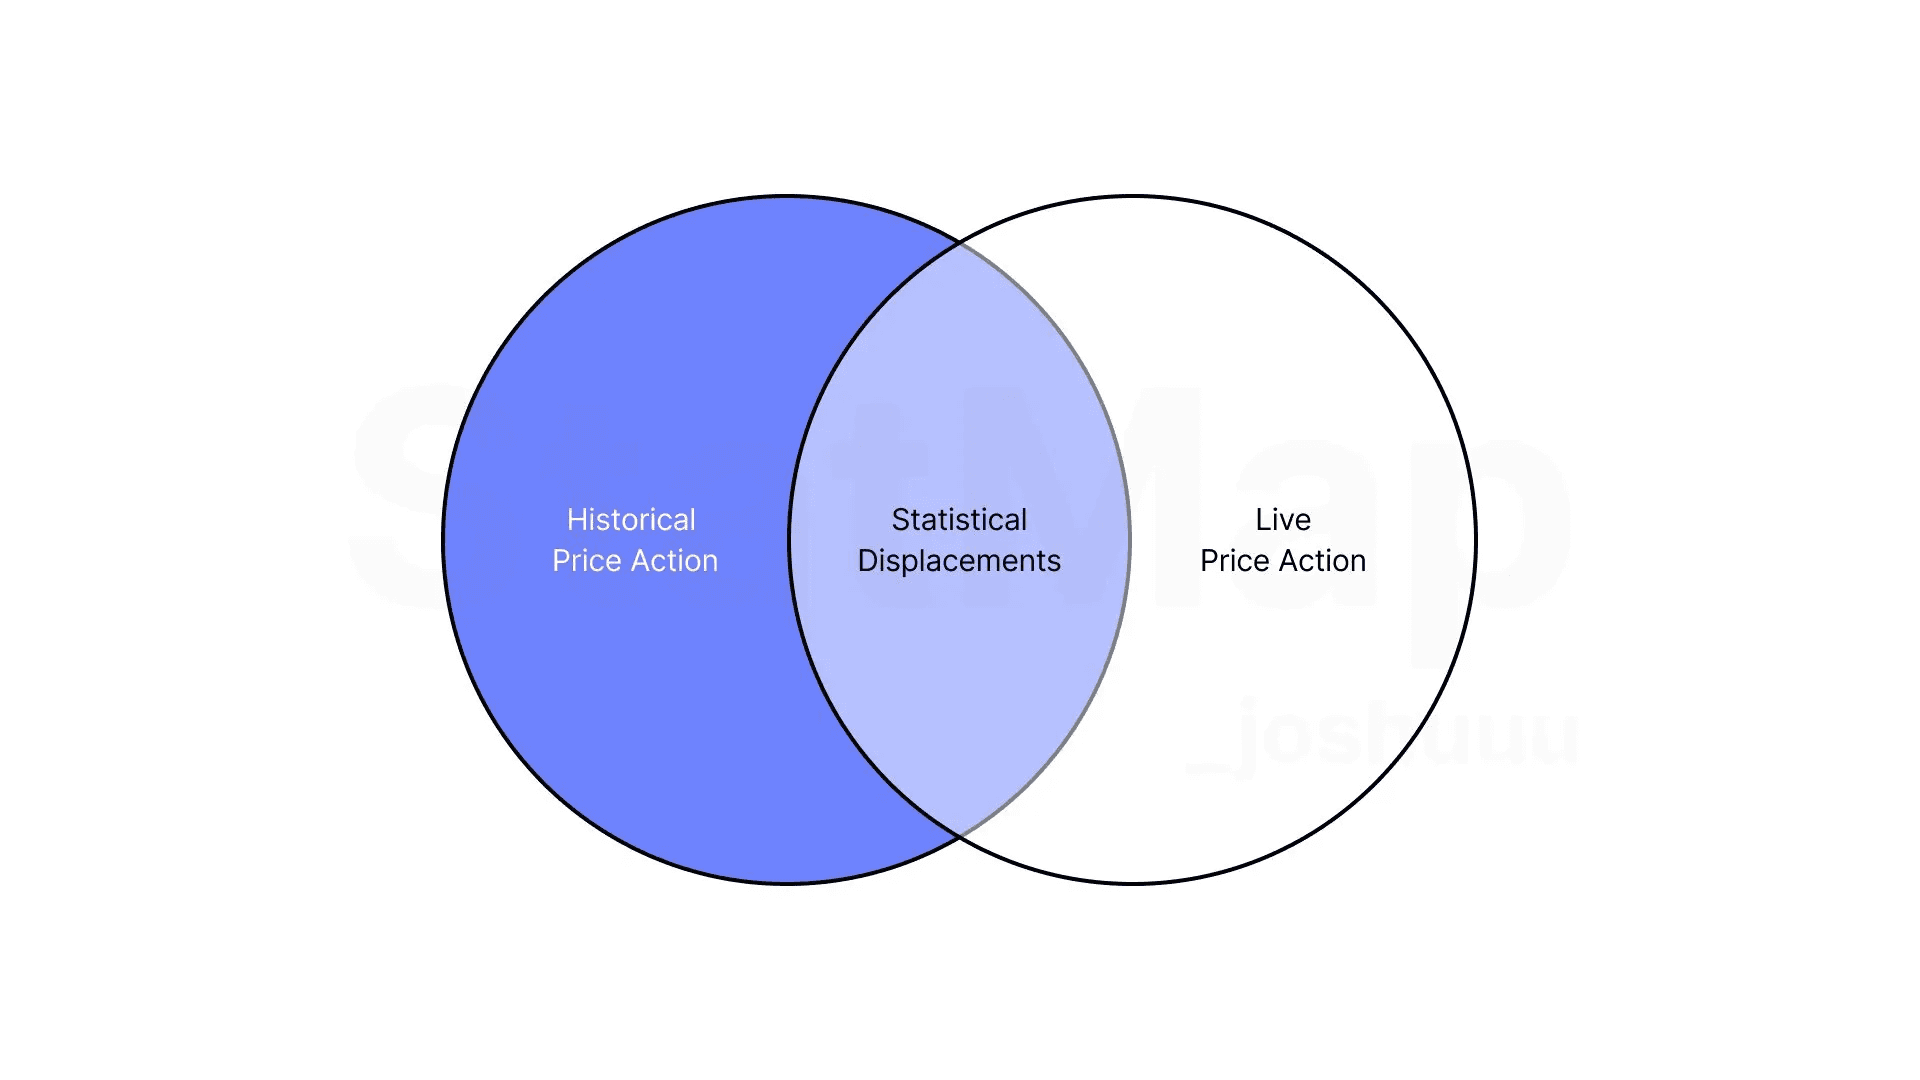
Introducing Statistical Displacements
Until now, Statistical Mapping was fully based on historical price action. With this new update, StatMap introduces Statistical Displacements– helping you follow big moves and institutional footprints in real time.
What Is Displacement?
Displacement signals sudden price bursts—when a candle becomes disproportionately large compared to historical averages. These bursts often hint at large orders or algorithmic action, possibly driven by institutional players.
Displacement Filter Levels:
Low (200%): Highlights any candle that’s 2x larger than its historical average.
Medium (300%)
High (400%)
Extreme (500%): Reserved for major imbalances—prime areas to suspect smart money involvement.
How It Works:
Stat-Map tracks candle sizes by timeframe. When a candle exceeds your chosen displacement threshold, it’s color-coded differently—instantly catching your eye.
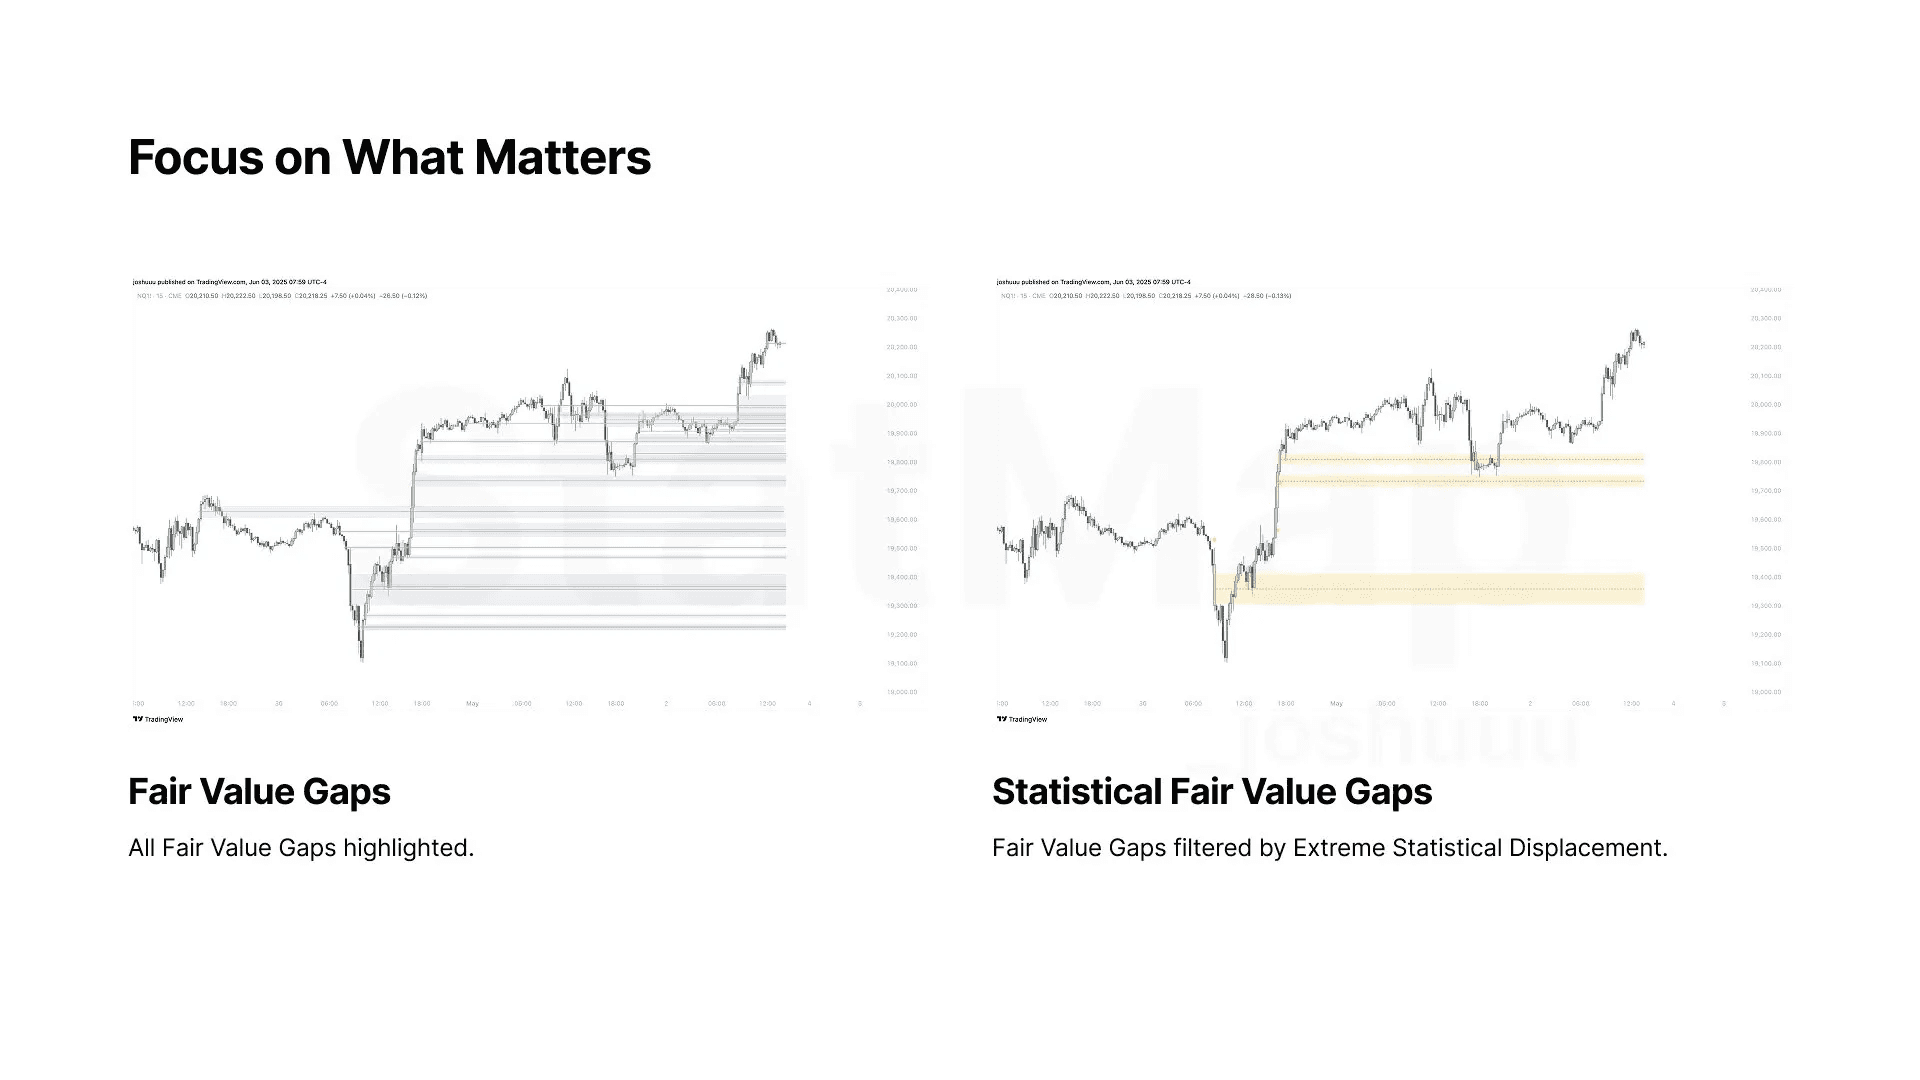
Not all imbalances are equal! 👁️
Filter Fair Value Gaps by statistical displacement to spotlight only those backed by significant price action – see the difference between noise and true institutional moves.
Related Articles
StatMap V4: Major Update
Statistical Mapping and Statistical Volatility have received their most significant update yet. Version 4 brings unified workflows, enhanced flexibility, and powerful new features that make these tool...
StatMap V3 – Update
New Script Update🚨 Midnight Levels are now consistent across all Timeframes! Dial in with Mean and Median Calculations – be confident about Current Contract levels, now backed by Historical Data....