StatMap V3 – Update
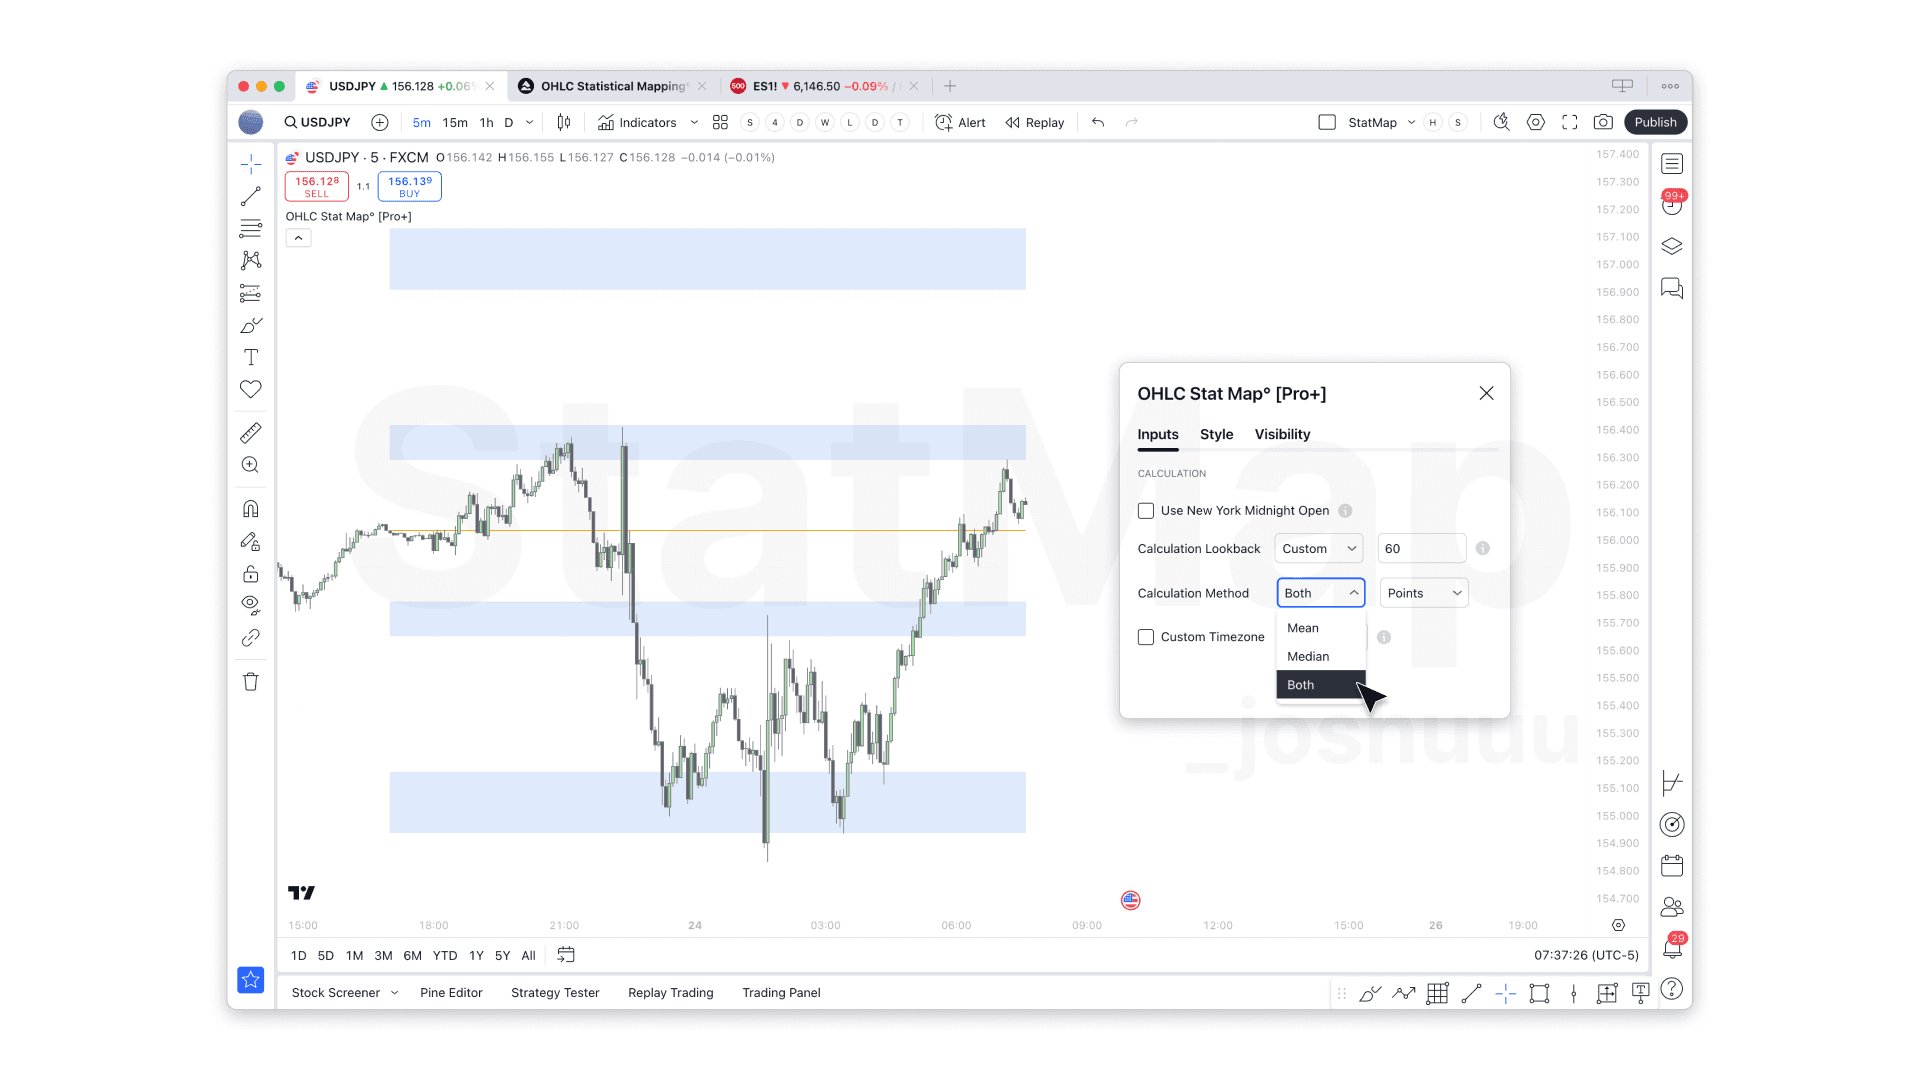
Mean, Median ... or Both?
In previous versions, users had to choose either Mean or Median for deriving levels. In response to community suggestions, we’ve introduced an option to display both calculations simultaneously. When you choose ‘Both,’ the indicator will plot a box spanning from the Mean level to the Median level, highlighting the entire range as a new Point of Interest. This visual helps you:
- Understand the variance between Mean and Median levels at a glance.
- Identify zones of potential price interaction more intuitively.
- Gain deeper insights into where real market turning points might emerge.
For more on how Mean and Median differ and when to use them, check out our recent post.
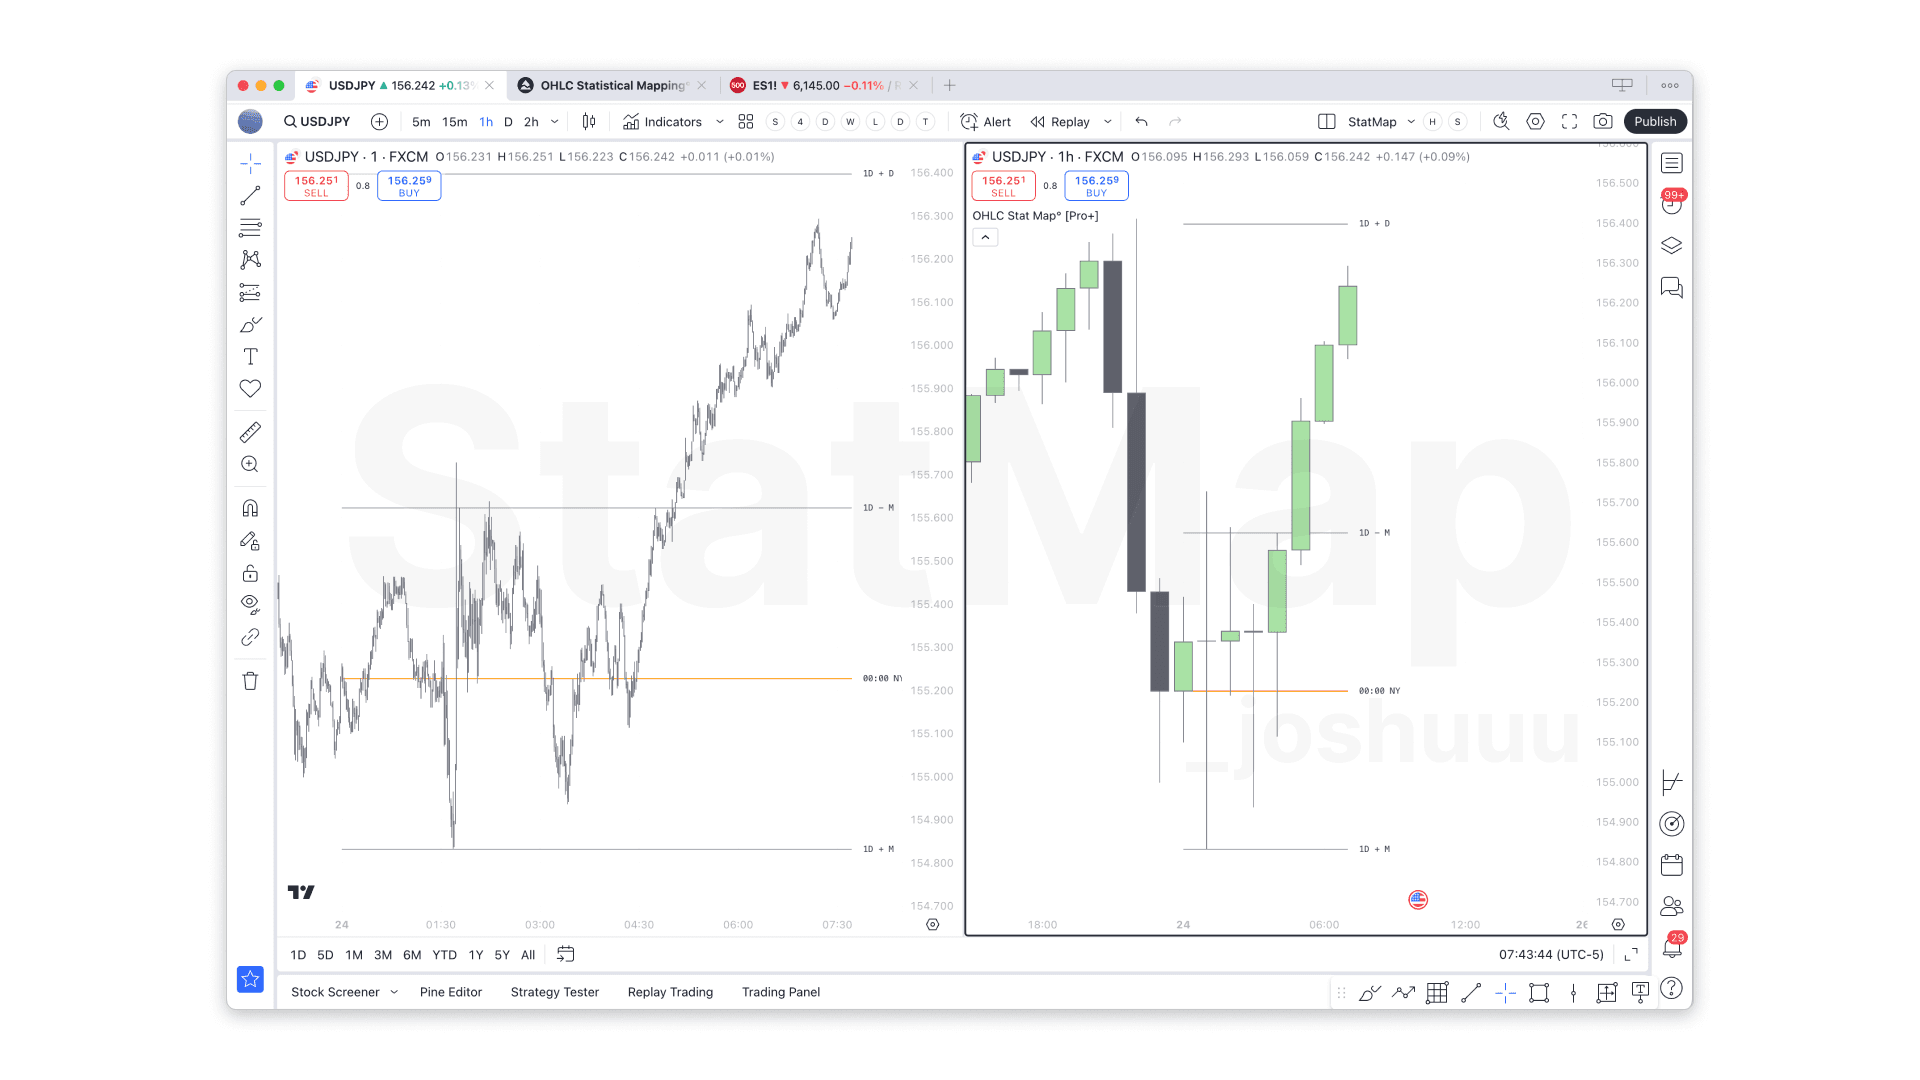
Enhanced Midnight Levels
We’ve made a significant upgrade to how midnight-based daily levels are handled. Previously, some users noticed discrepancies when switching between timeframes. Now, as in other OHLC StatMap levels, the daily levels anchored to New York midnight automatically adjust to remain consistent across all timeframes. This change ensures:
- Reliable historical data backtesting for daily sessions.
- Smoother transitions when switching timeframes.
- Harmonized levels for a more robust statistical foundation.
Now, on futures charts, midnight projections can be plotted on all timeframes up to the daily, even when there is no actual candle aligning with the midnight open price. On non-futures charts, these projections are available for hourly timeframes and below.
Minor Fixes & UI Improvements
Previously, we recommended using continuous futures contracts for their extensive historical data, but that’s no longer necessary. Now, you can use any quarterly contract with the same level of precision. We’ve also resolved minor bugs and enhanced performance. The Settings menu has been redesigned for a more intuitive experience, making it easier than ever to customize the StatMap indicators.
Get Started With V3
If you’re an existing subscriber, simply update your TradingView indicator to V3 (it should update automatically if you’re using the published version). New to OHLC StatMap [Pro+]? Visit our website or join our Discord to learn more about how our advanced statistical indicators can give you an edge in the markets.
We appreciate your continued support and feedback—please keep sharing ideas in our community Discord so we can keep improving. Happy trading!
— The OHLC StatMap Team
Related Articles
StatMap V4: Major Update
Statistical Mapping and Statistical Volatility have received their most significant update yet. Version 4 brings unified workflows, enhanced flexibility, and powerful new features that make these tool...
Introducing Statistical Volatility 2.0 👀
Statistical Volatility 2.0 brings powerful new tools to StatMap, making market analysis sharper and more actionable. The new Volatility Filter lets you instantly highlight calm, trending, or highly ac...