Combining StatMap and StatVol
Introduction
One of the most frequently asked questions is how to effectively combine the StatMap and StatVol indicators. While each tool is powerful on its own, using them together creates a comprehensive statistical framework that identifies both where price is likely to reverse and when moves are statistically significant.
In this article, we'll explore three proven methods for integrating these indicators to find high-probability trading opportunities.
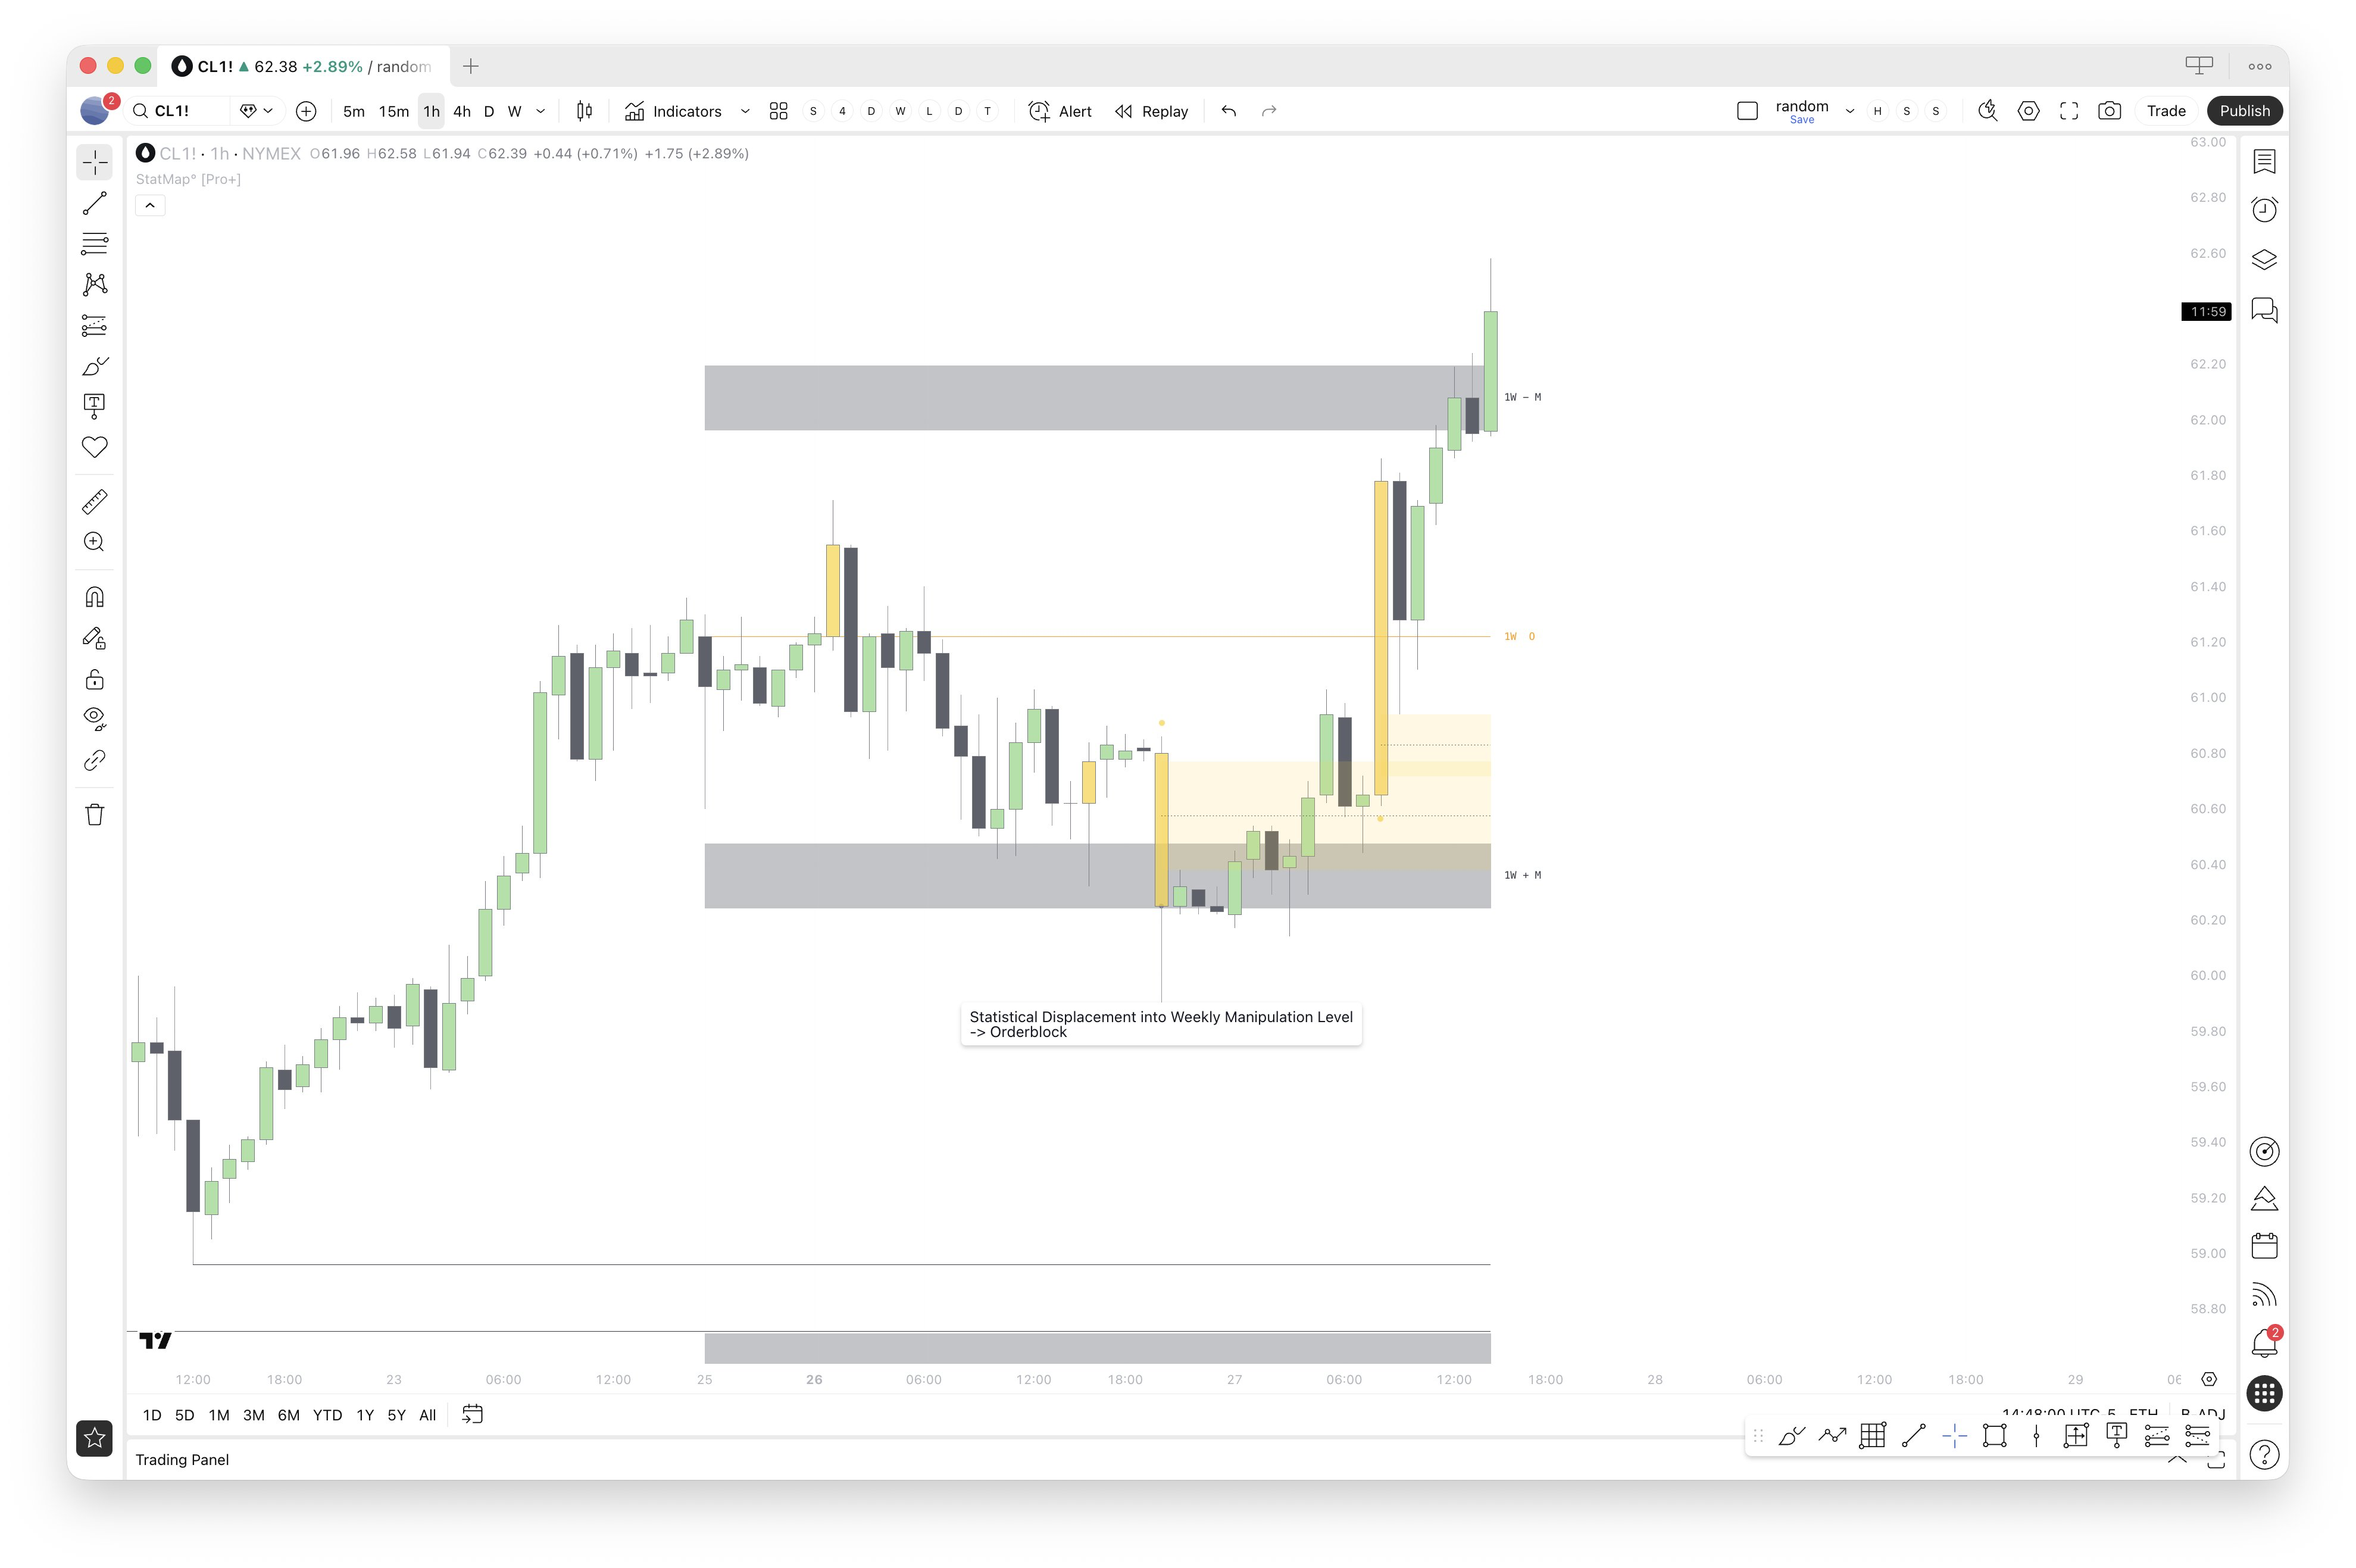
Method 1: Statistical Displacement into a StatMap Level
The first approach involves looking for a statistical displacement that moves price into a StatMap level, followed by a reversal. When price aggressively displaces into a key StatMap level with above-average volatility, it signals a potential exhaustion point.
How to Apply This Method
Identify a StatMap manipulation or distribution level on your chart
Wait for a StatVol displacement candle to push price into this level
Look for reversal confirmation after the displacement
The displacement candle itself can be utilized as an orderblock for entries
This combination works because the StatVol displacement confirms that the move into the level was statistically significant, while the StatMap level provides the logical reversal point.
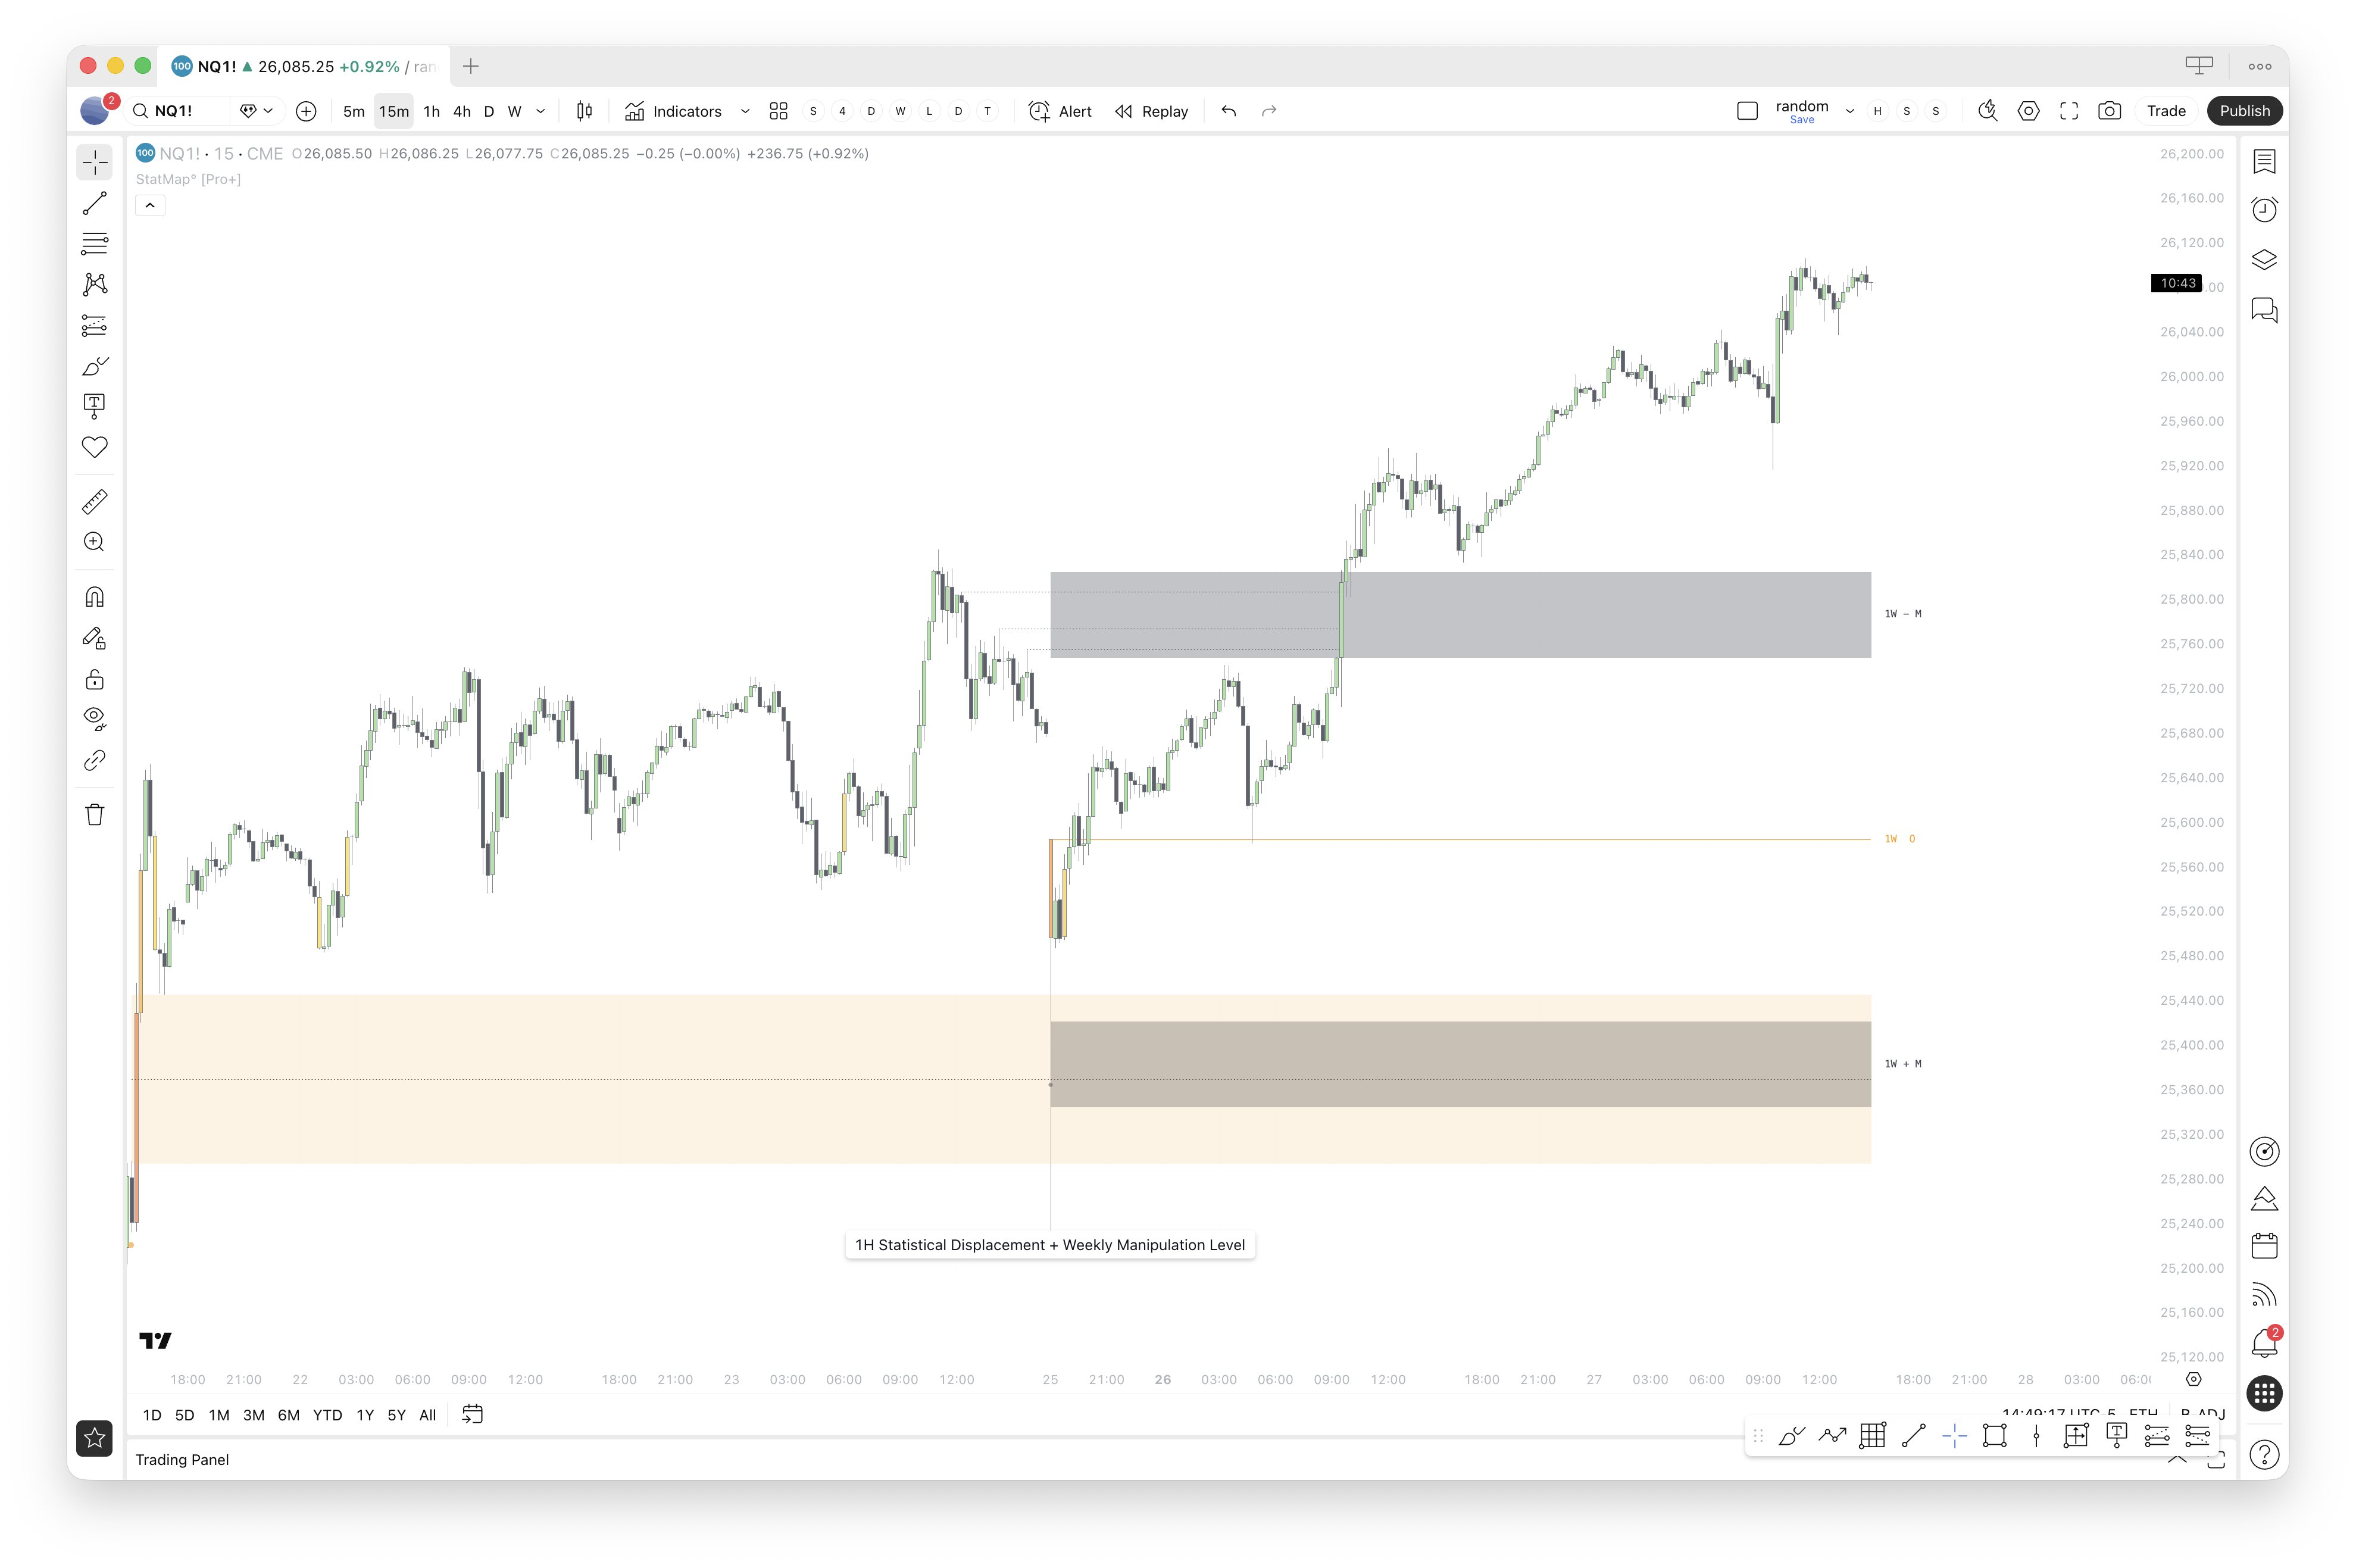
Method 2: HTF Statistical Displacement Levels as Points of Interest
The second method uses higher timeframe Statistical Displacement levels as points of interest (POIs) for potential reversals. This is especially powerful when these displacement levels align with StatMap levels.
How to Apply This Method
Identify HTF (1H, 4H, or Daily) Statistical Displacement zones from StatVol
Look for confluence with StatMap projection levels
When price returns to these zones, anticipate reversal opportunities
The alignment of both statistical frameworks increases probability
Higher timeframe displacements mark areas where significant volatility occurred historically. When these zones overlap with StatMap levels, they become high-confluence reversal zones that institutional traders often target.
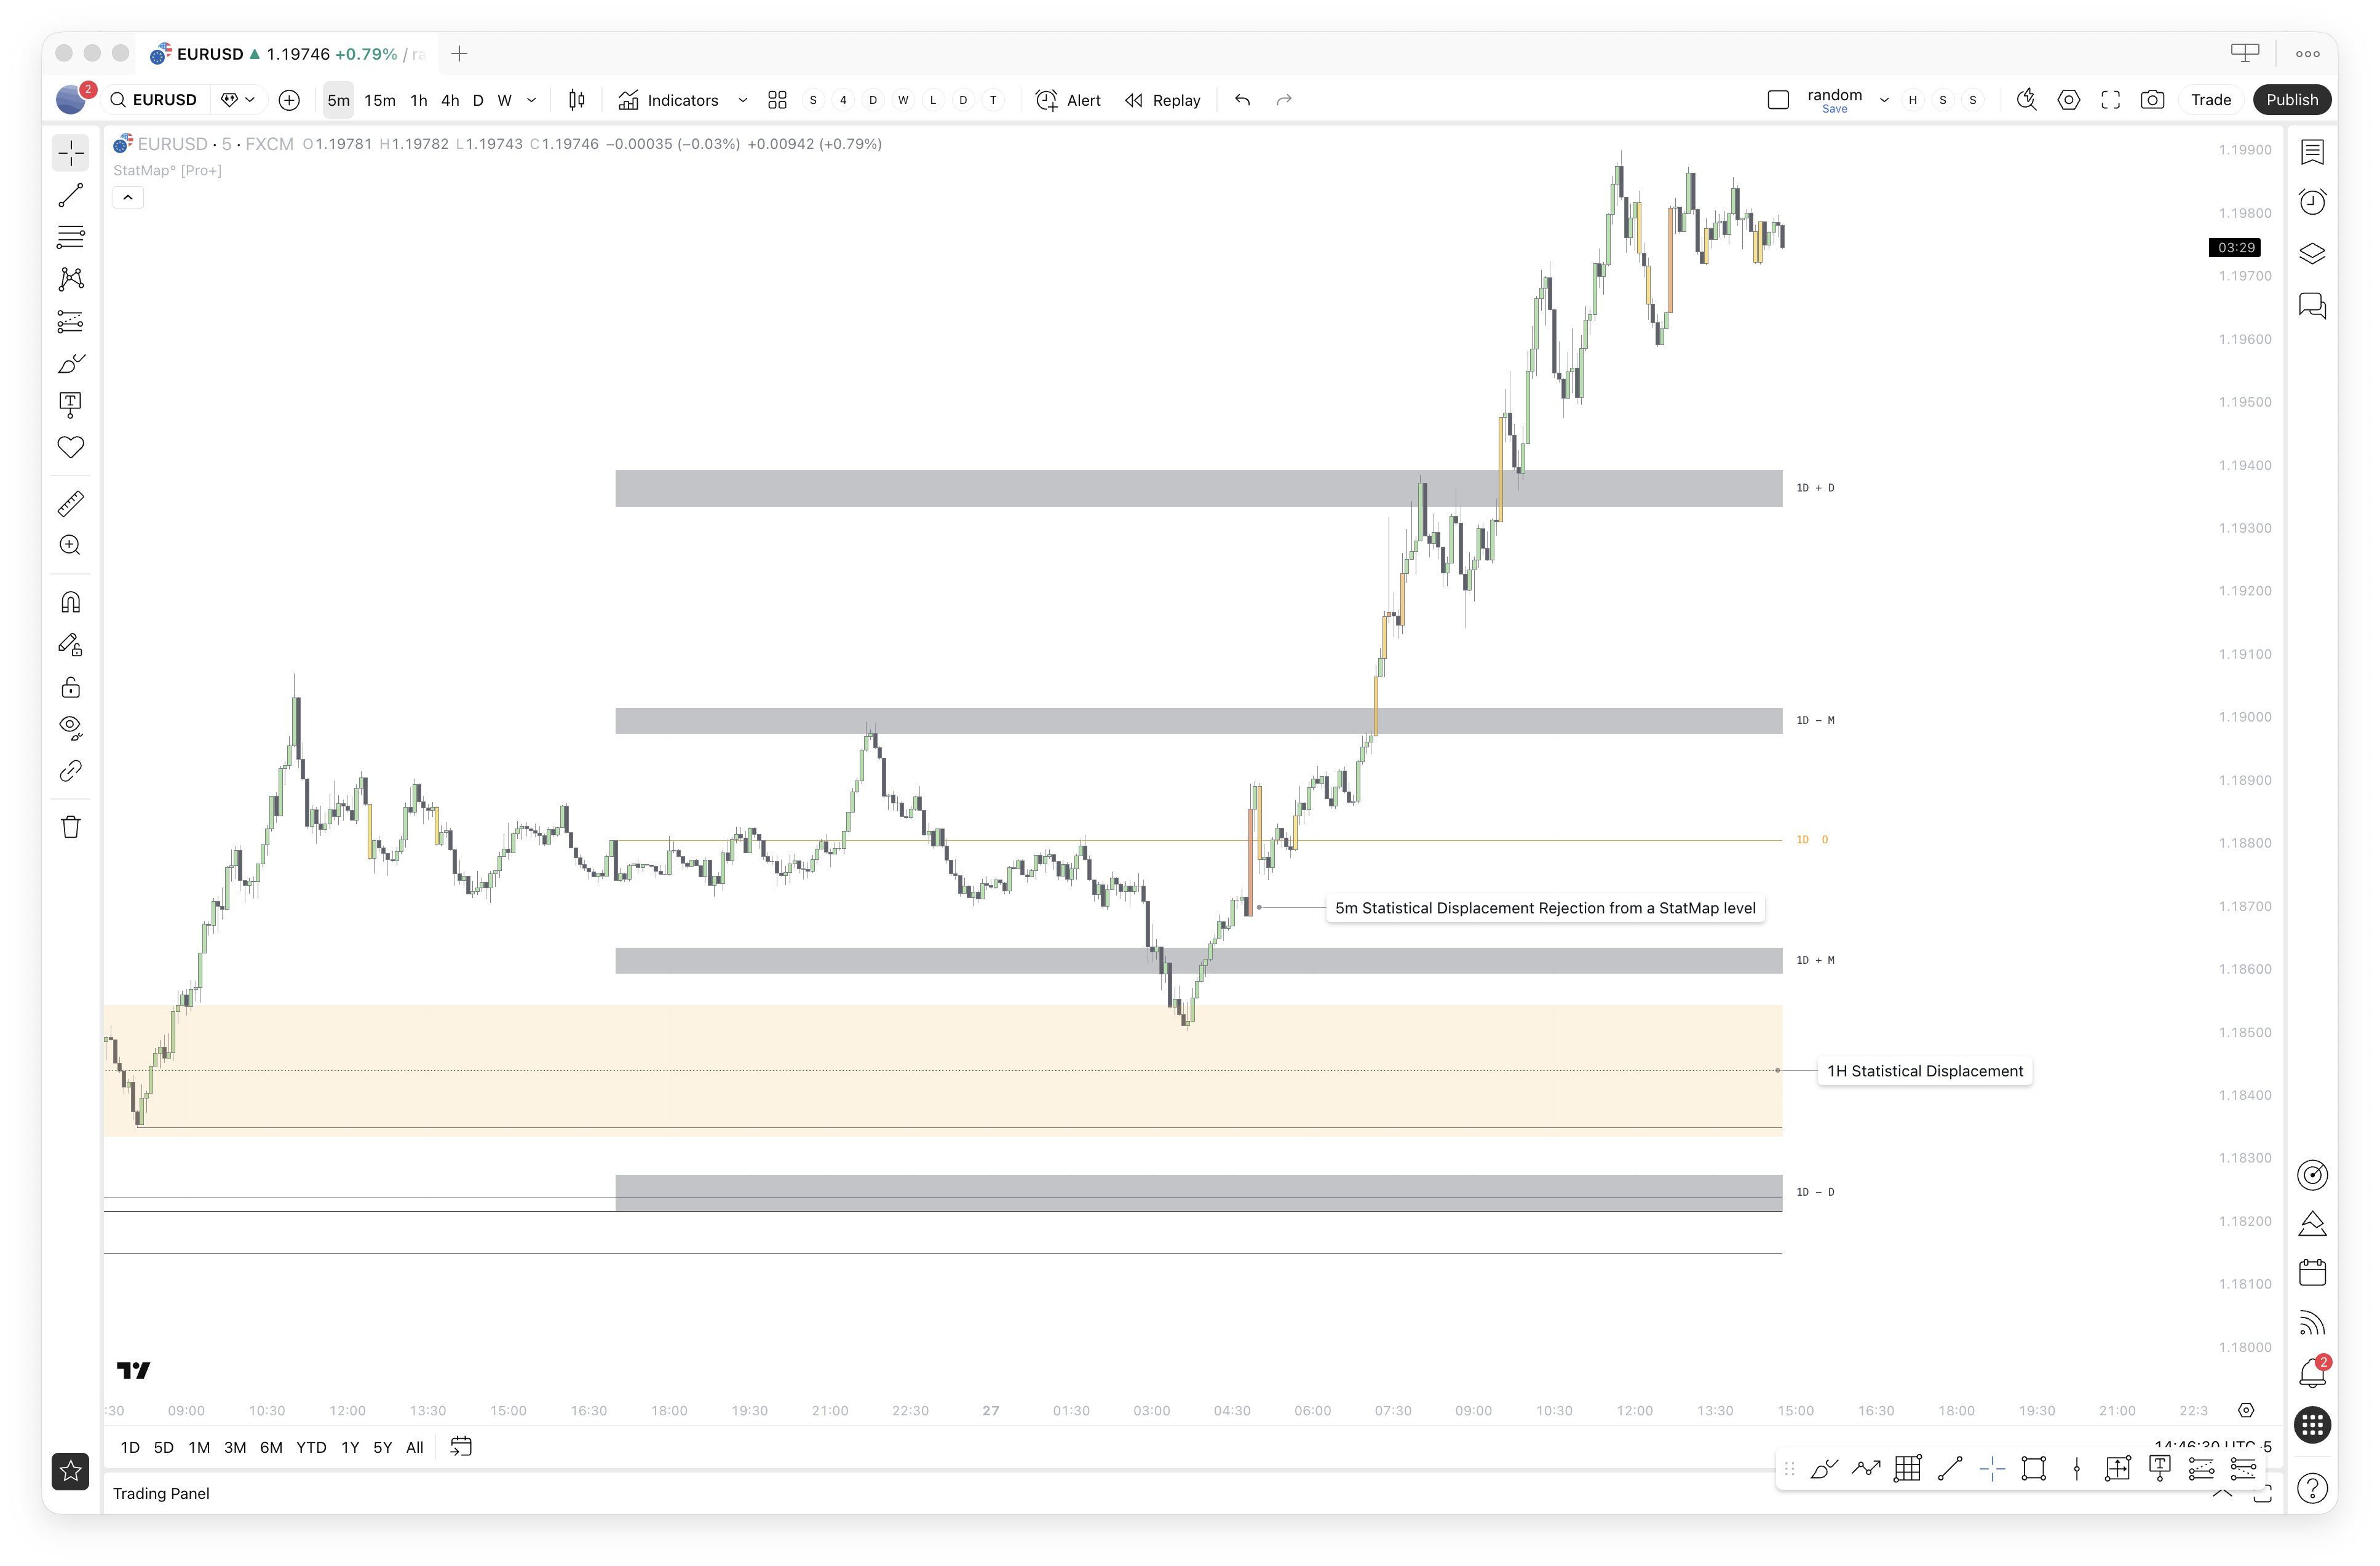
Method 3: Statistical Displacement Away from a StatMap Level
The third approach looks for statistical displacements that move price away from a StatMap level. This confirms that the level is acting as a valid support or resistance zone and that the market is respecting the statistical framework.
How to Apply This Method
Identify when price reaches a StatMap level
Watch for a StatVol displacement candle rejecting from this level
The displacement confirms the level's significance with above-average volatility
Use the displacement as confirmation for trade entries in the rejection direction
When price rejects from a StatMap level with a statistical displacement, it validates that the level holds significant meaning. The above-average volatility on the rejection shows that market participants are actively defending or attacking this price zone.
Practical Tips for Combining Both Indicators
To maximize the effectiveness of using StatMap and StatVol together:
Multi-timeframe alignment: Look for StatMap levels on higher timeframes and displacement confirmations on lower timeframes
Displacement strength: Configure your StatVol displacement strength to filter out noise and focus on significant moves
Time confluence: Use StatVol's killzone analysis to identify when displacements are most likely to occur
Wait for confirmation: Don't anticipate — wait for either the displacement into a level or the rejection from a level to occur
Conclusion
Combining StatMap and StatVol provides a complete statistical trading framework. StatMap identifies where price is likely to find support, resistance, or reversal points, while StatVol confirms when price movements are statistically significant. Together, they help traders filter out market noise and focus on high-probability setups backed by historical data.
Whether you prefer to trade displacements into levels, use HTF displacement zones as POIs, or wait for displacement rejections from key levels, these three methods offer reliable approaches to leveraging both tools effectively.
Related Articles
Custom Daily Anchor
Learn how to customize the daily anchor for your trading indicators to better align with your instrument's active session.
What is Statistical Mapping?
Statistical Mapping is a suite of statistical trading tools designed to help traders anticipate volatility and reversal points across any available timeframe and session on any ticker in TradingView....