What is Statistical Volatility?
The Core Concept
Statistical Volatility analyzes historical volatility patterns to help traders understand when and where significant price movements are most likely to occur. The tool provides a statistical framework for identifying abnormal market behavior and high-probability reversal zones.
How It Works
The indicator collects volatility data across historical periods and projects expected volatility for current and future timeframes. By comparing current market behavior against historical averages, traders can identify when price movements are statistically significant.
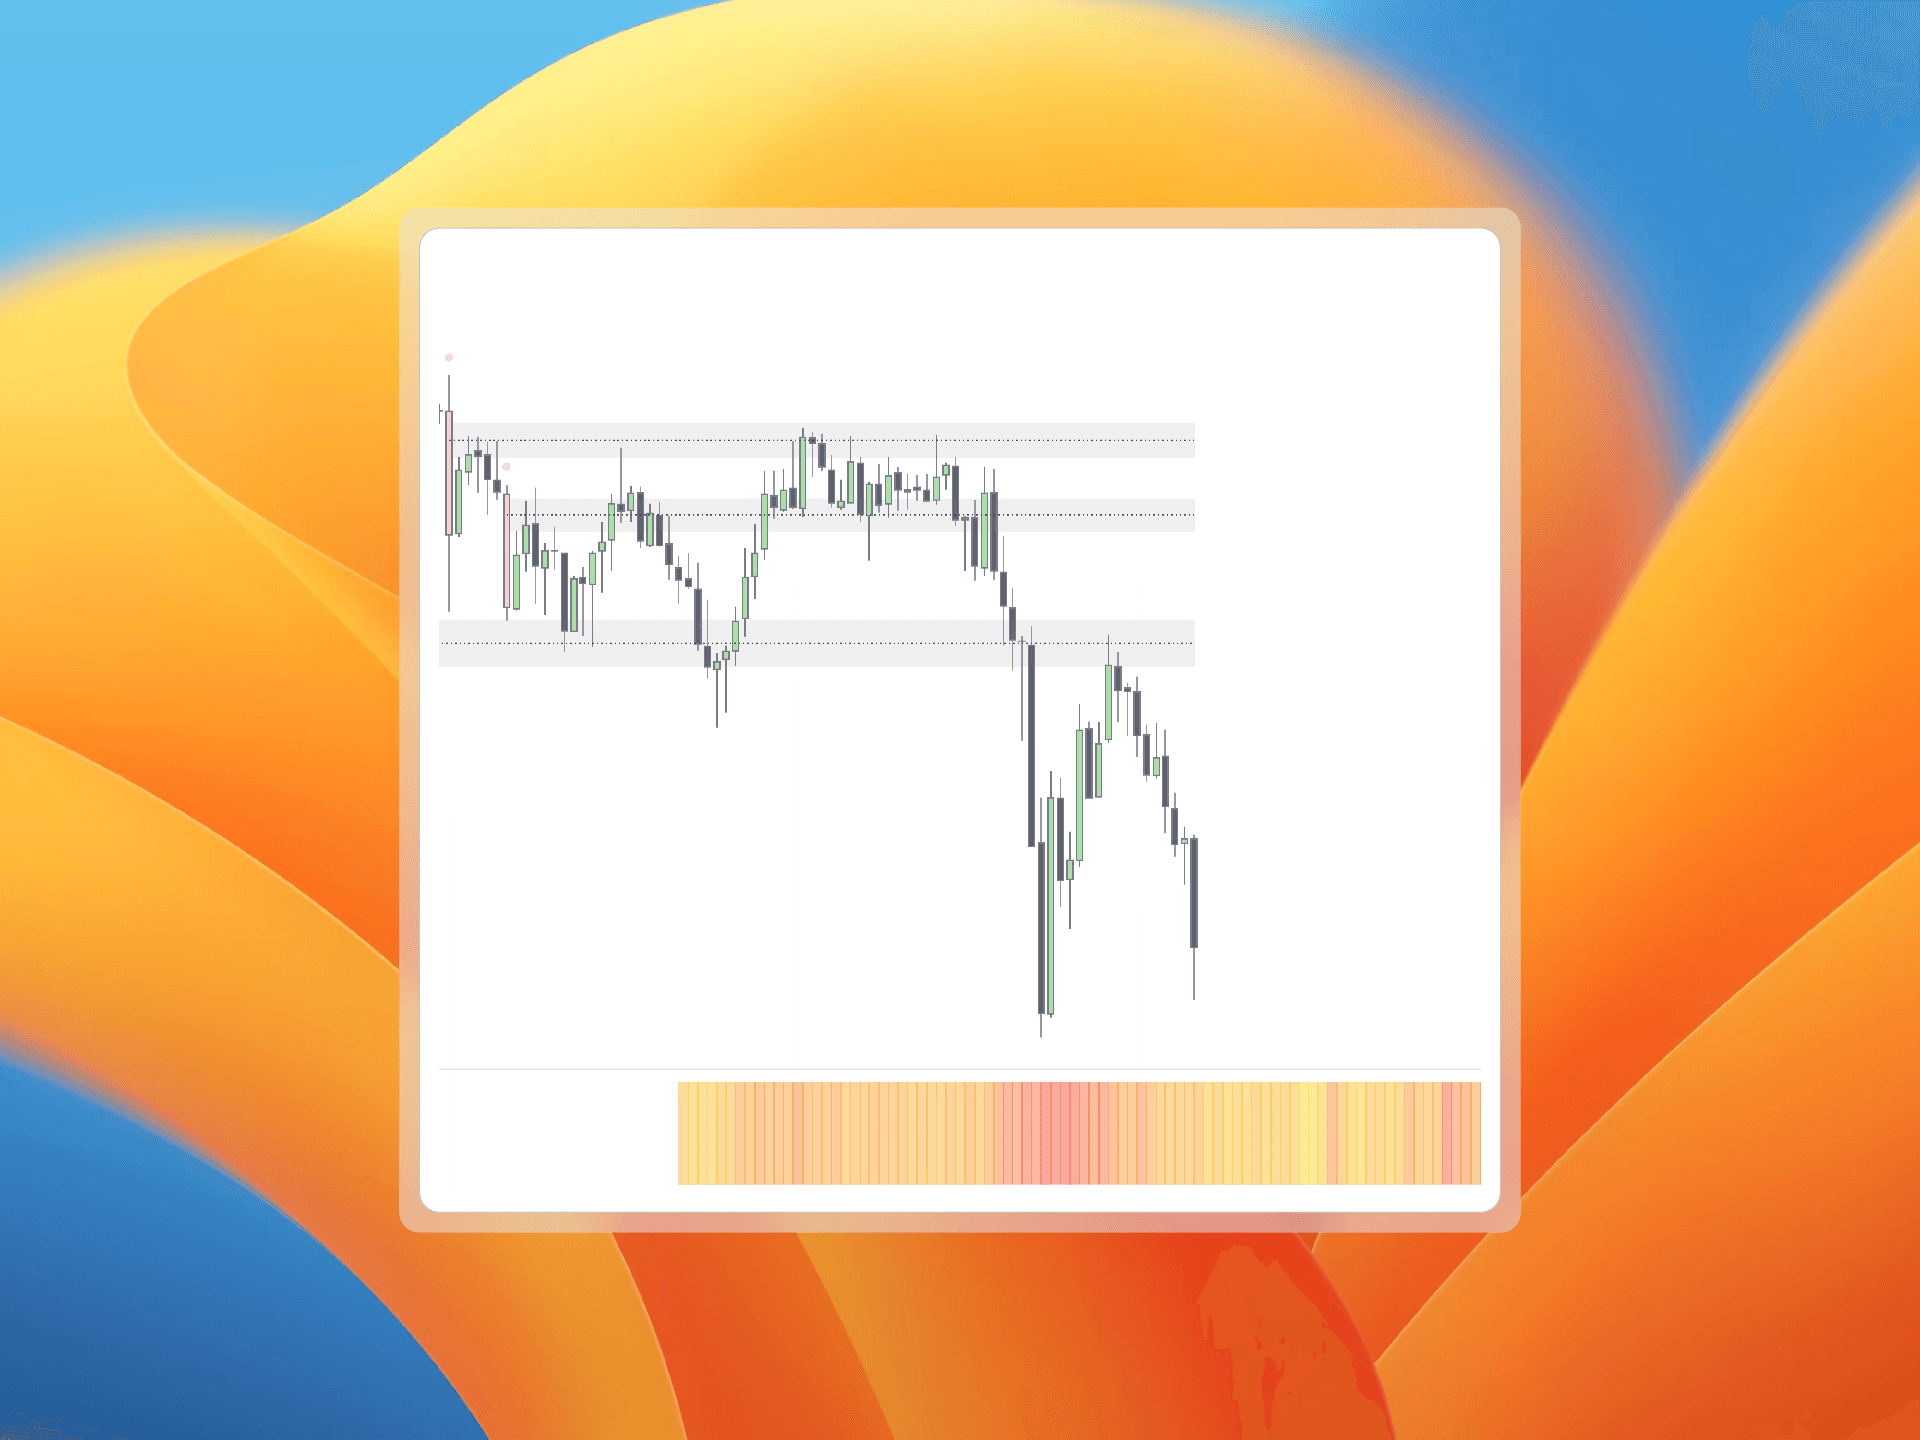
Heatmap and Histogram Visualization
Statistical Volatility displays collected volatility data through a heatmap or histogram view. This visualization shows projected expected volatility and makes it easy to identify patterns in market activity across different times and price levels.
Real-Time Displacement Detection
The tool highlights candles with unusual volatility compared to historical averages. Current volatility can be overlaid with historical data to spot abnormal market behavior as it develops.
Statistical Volatility detects when price moves are statistically significant compared to normal market behavior, giving traders an edge in spotting high-probability reversal zones.
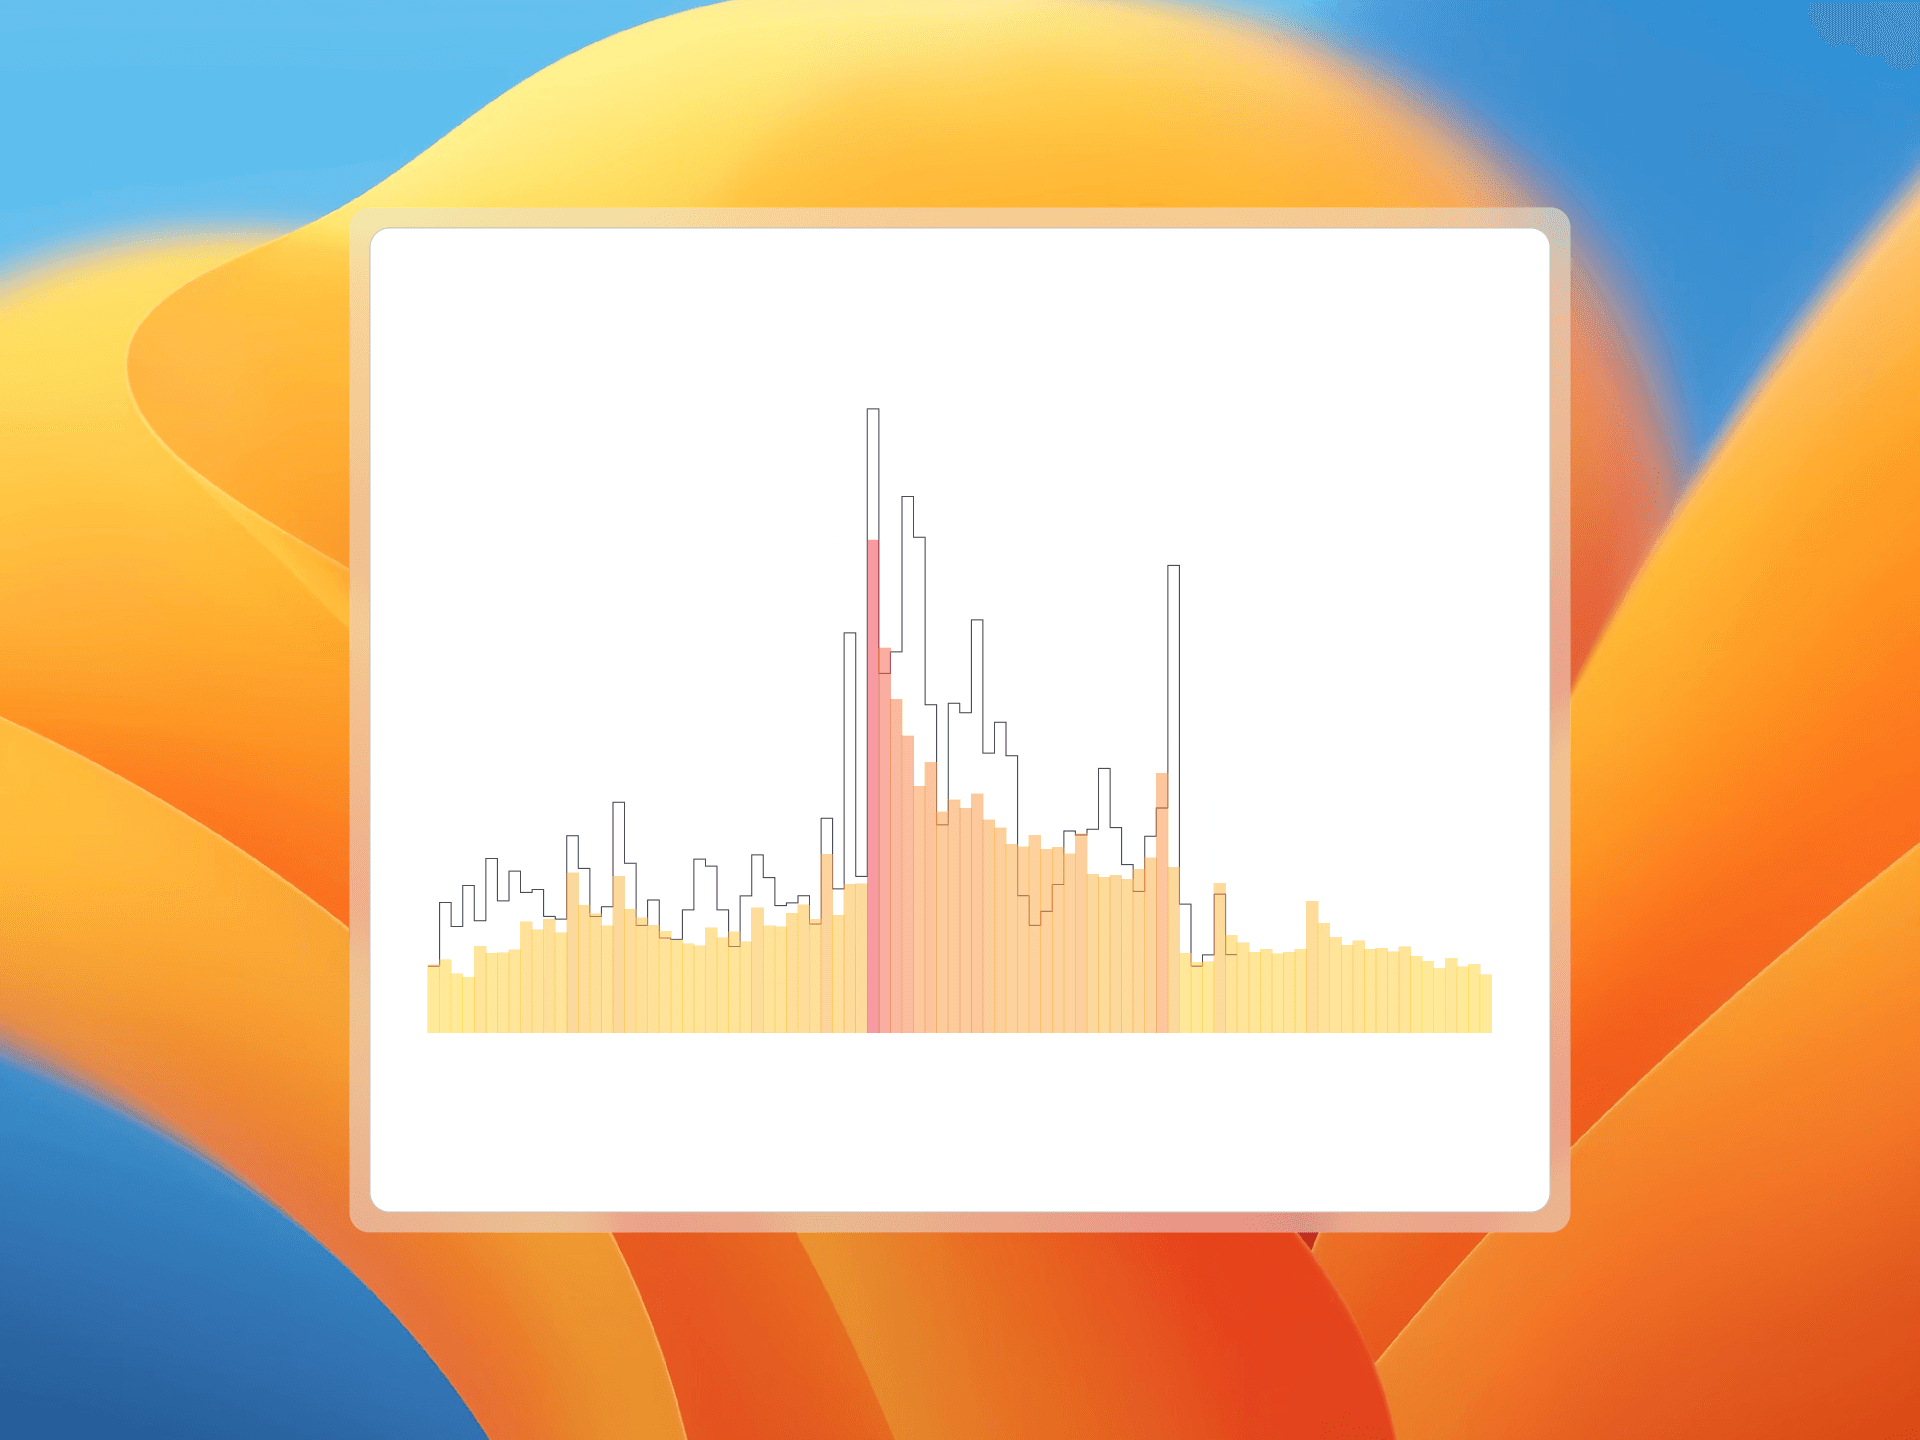
Graph Pane Analysis for Identifying Killzones
Statistical Volatility includes a graph pane feature that tracks current volatility against historical patterns in real-time. This tool is specifically designed to help traders identify "Killzones" — periods when the histogram shows that certain times consistently exhibit elevated volatility, presenting the highest-probability trading opportunities.
By overlaying current volatility data with historical patterns, the graph pane allows traders to compare whether current market conditions are typical or exceptional relative to historical behavior. This comparison provides immediate context for understanding market activity during key periods such as the Asia session open, London open, major US economic data releases, and the New York equity market open.
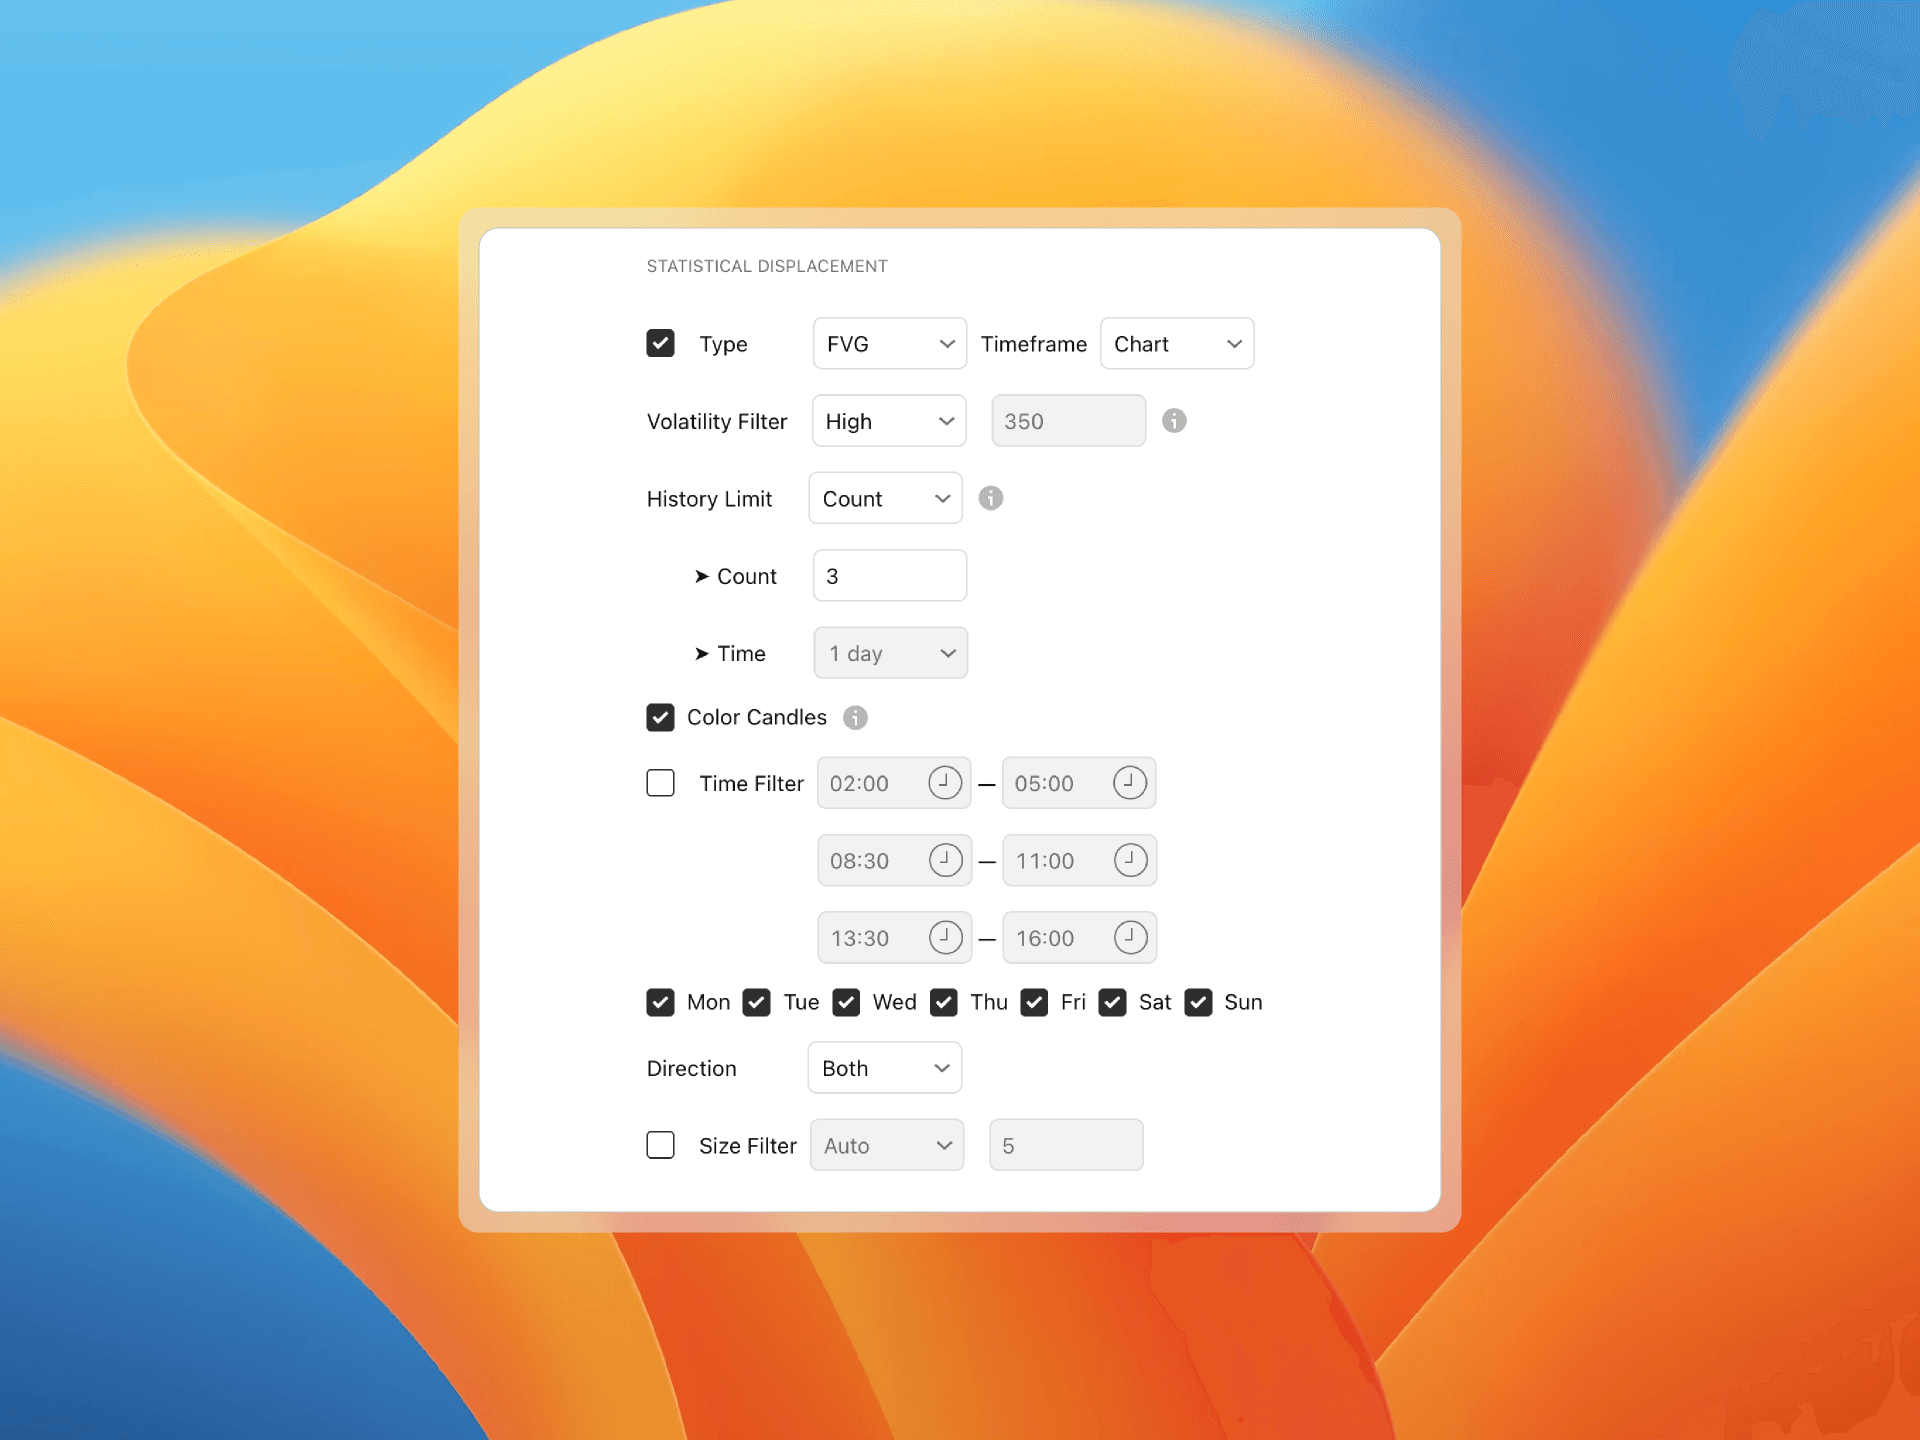
Statistical Displacement Strength
The tool includes configurable displacement strength levels that help traders filter market movements based on their statistical significance.This allows traders to focus on moves that deviate meaningfully from typical behavior.
Visualization Types
Statistical Volatility offers multiple visualization options including:
Fair Value Gap (FVG) representation
High-Low range display
Open-Close body focus
Traders can select the visualization type that best matches their analytical approach.
Time and Day Filtering
The indicator supports time and day filters, allowing traders to focus on specific periods that matter most to their trading strategy. This helps eliminate noise from periods with lower statistical relevance.
Practical Application
By integrating real-time statistical displacements with powerful filtering options, Statistical Volatility helps traders:
Identify which periods and price levels are statistically most likely to offer large moves
Plan entries based on expected volatility windows
Set stops and targets aligned with typical volatility ranges
Recognize when market behavior deviates from statistical norms
Integration with Statistical Mapping
While Statistical Mapping focuses on price levels and reversal points, Statistical Volatility adds the dimension of understanding the magnitude and timing of price movements. Together, these tools provide a comprehensive statistical framework for trading decisions.
Traders can use Statistical Volatility to validate the significance of moves toward Statistical Mapping projection levels, building confidence that observed price action represents meaningful market behavior rather than normal fluctuation.
Configuration
To configure Statistical Volatility:
Open Statistical Volatility settings
Select your preferred Displacement Strength Level
Choose your Visualization Type (FVG, High-Low, or Open-Close)
Set Time and Day Filters as needed
Enable Graph Pane Analysis for real-time tracking
The tool provides flexibility to adapt to various trading styles and timeframe preferences while maintaining statistical rigor in identifying significant market movements.
Related Articles
Combining StatMap and StatVol
Learn three powerful ways to combine StatMap and StatVol indicators for high-probability trading setups using statistical displacements and key levels...
Custom Daily Anchor
Learn how to customize the daily anchor for your trading indicators to better align with your instrument's active session.