Understanding the Breaker/Unicorn Setup
Learn how the breaker block captures liquidity before a reversal and how a Fair Value Gap inside it creates the higher probability Unicorn setup.
The Breaker Block pattern is a powerful price action setup that captures liquidity before a reversal. Learn how it works, why it’s effective, and how to enhance it with Fair Value Gaps for higher probability trades.
The Breaker Block Pattern
A bullish breaker block pattern consists of a low, a high, a lower low, and a higher high. Ideally, the lower low that leads to a sharp reversal forms at a key level or point of interest. This setup is effective because it generates a lot of liquidity in both directions before making its move.
A bearish breaker block follows the opposite structure: high, low, higher high, and lower low, with the higher high ideally forming at a key level before a sharp decline.
This pattern works well because it attracts traders on both sides—those trading breakouts and those looking to fade the move—leading to liquidity accumulation, which facilitates the final directional push.
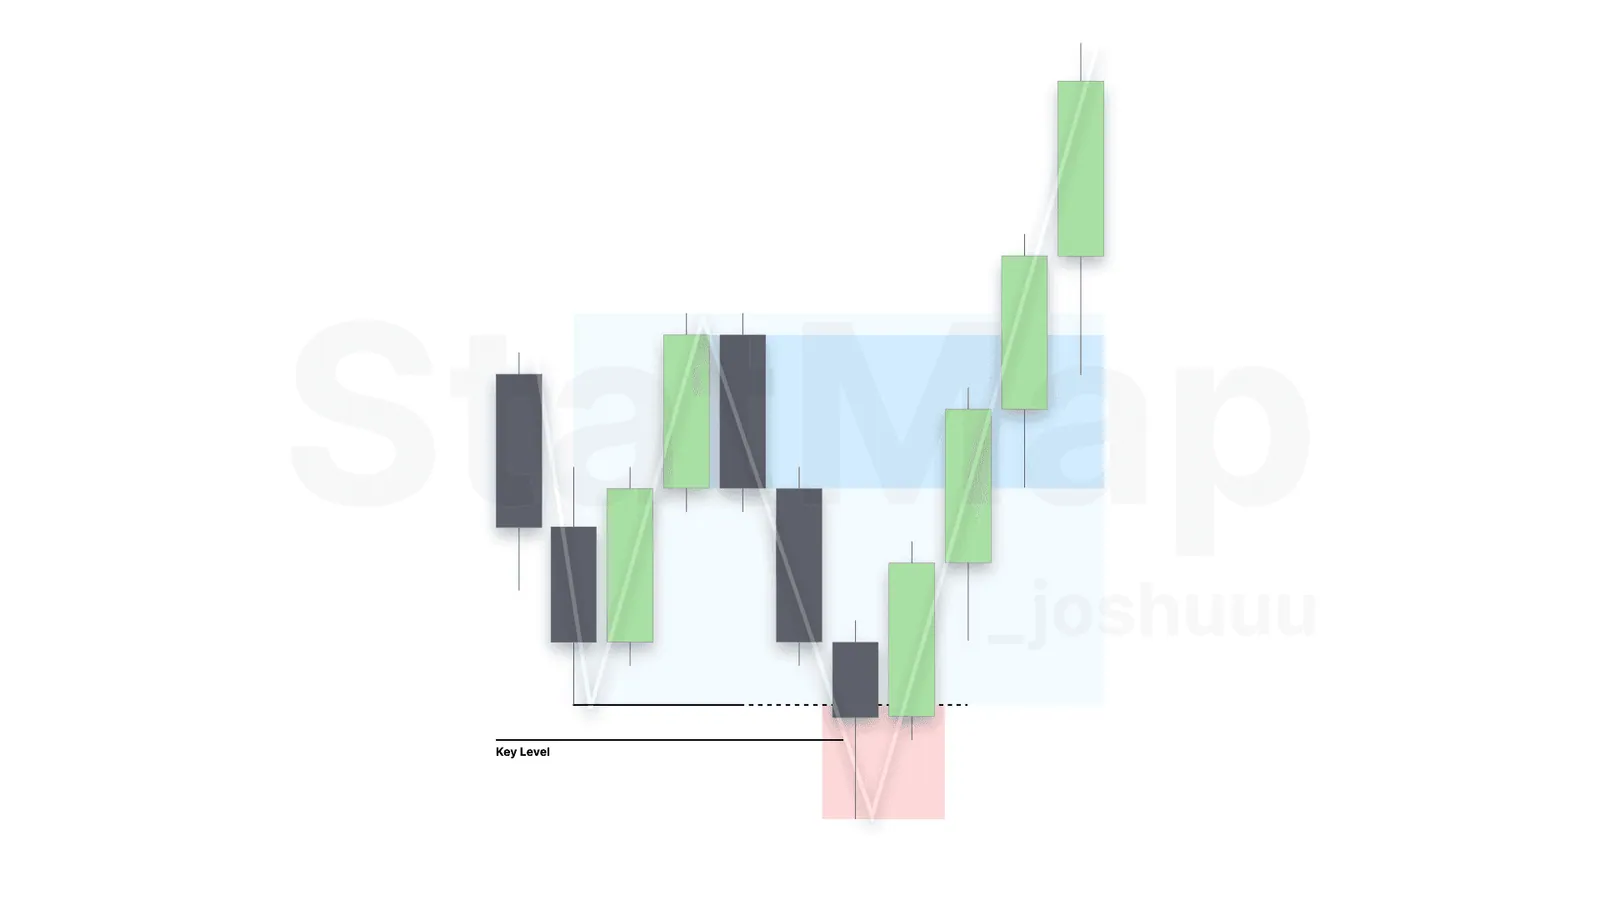
Understanding the Breaker Block
The breaker block refers to the price swing before the move that took out the liquidity. The most sensitive part of the breaker block is:
- The highest up-closed candle on bullish breakers
- The lowest down-closed candle on bearish breakers
These levels are often revisited before price continues in its new direction.
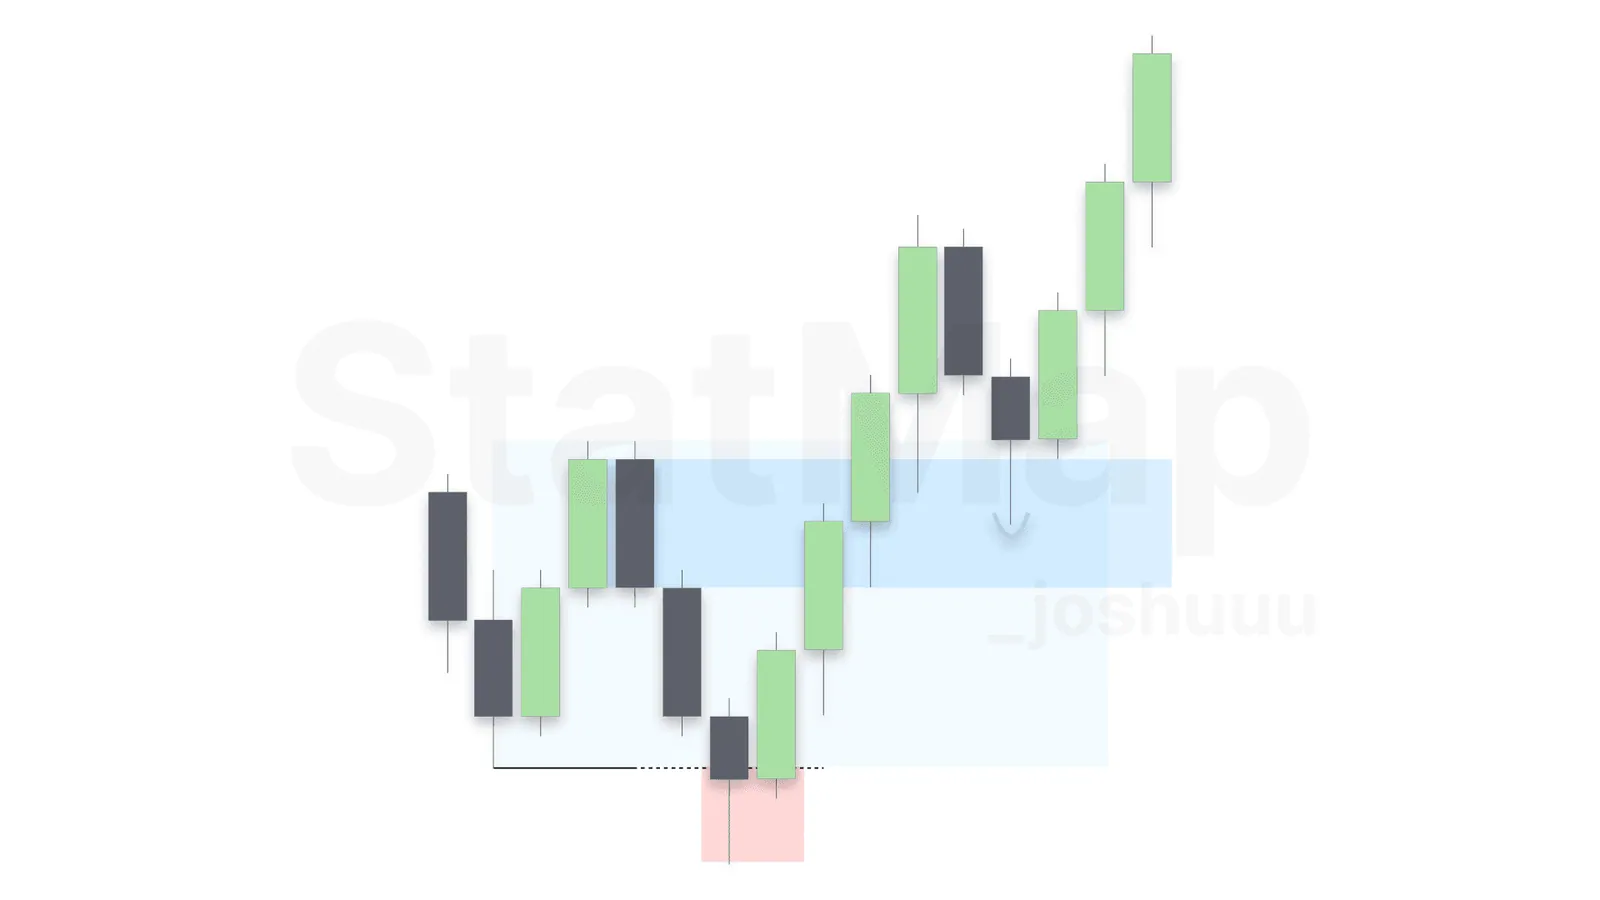
The High-Probability Unicorn Setup
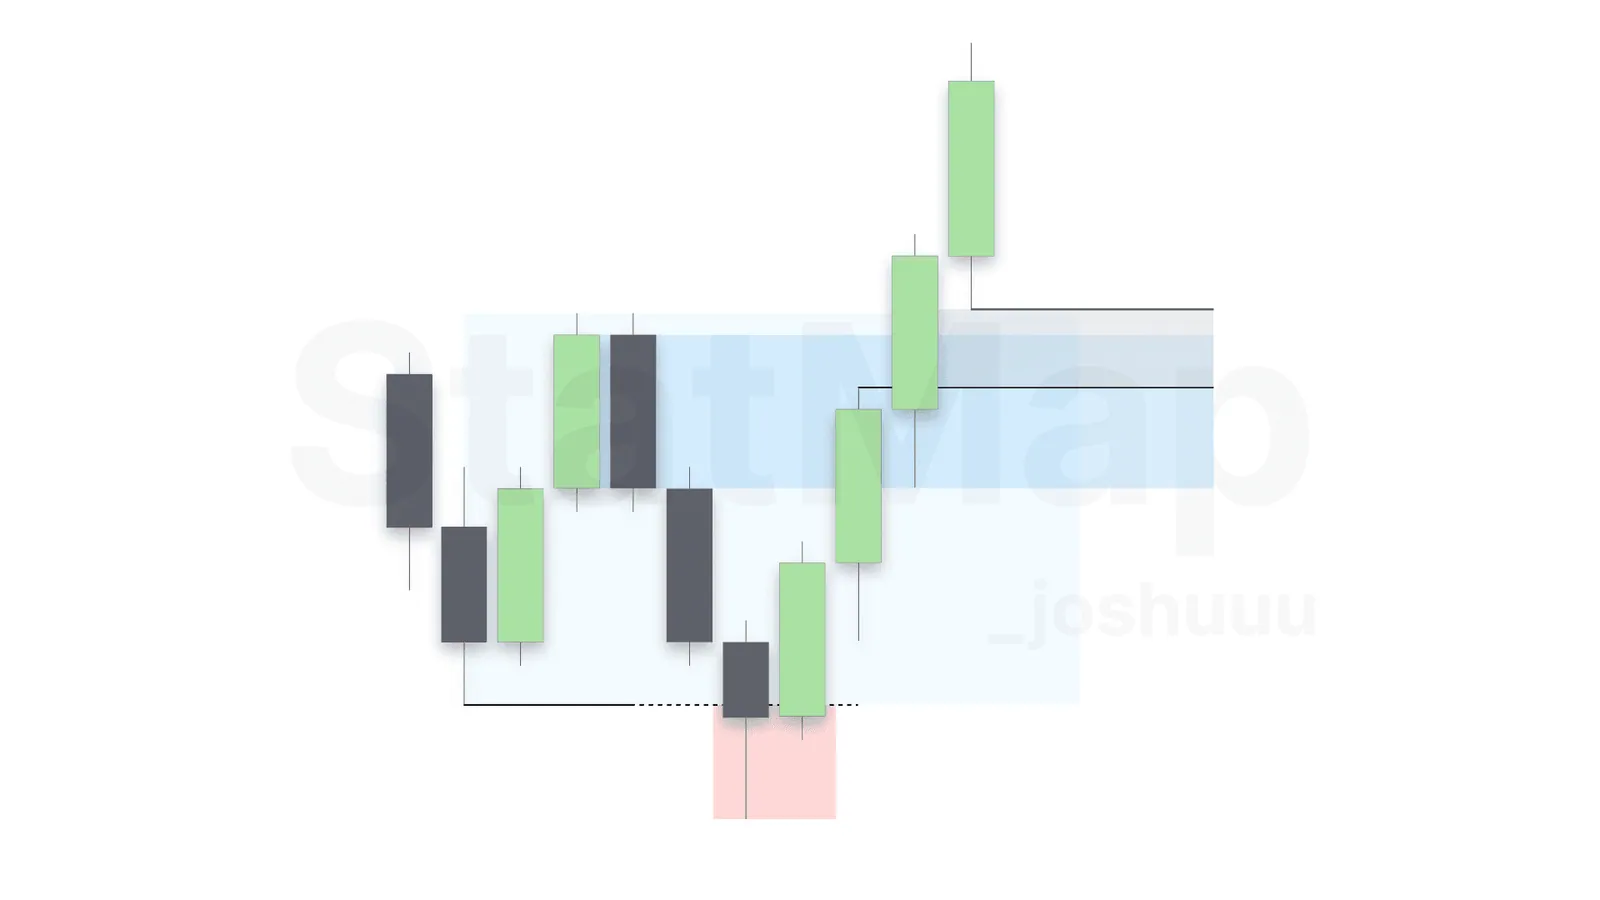
When a Fair Value Gap aligns with the breaker block, this is considered a higher probability setup, commonly called a Unicorn.
JunoTrading has done an in-depth manual on how he uses the Statistical Mapping° indicator as a key level for his Unicorn Model. If you are new to the levels themselves, start with What is Statistical Mapping?. You can find it here: JunoTrading's Unicorn Model
Put it on your chart
Get Statistical Mapping° and Statistical Volatility° for TradingView, or ask StatMap AI about settings and setup.
Related articles
Fair Value Gaps
Learn how the three-candle Fair Value Gap forms, how bullish and bearish FVGs act as support and resistance, and when they flip into inversion FVGs.
Understanding Accumulation, Manipulation, and Distribution in Trading
Understand the accumulation, manipulation and distribution phases of the Power of Three and how Statistical Mapping° levels help you anticipate each phase.
OHLC/OLHC – The Foundation of Price Action
OHLC and OLHC describe the order in which a candle forms its open, high, low and close. Learn how this sequence helps you read price action.