StatMap V3 – Update
Mean, Median ... oder beides?
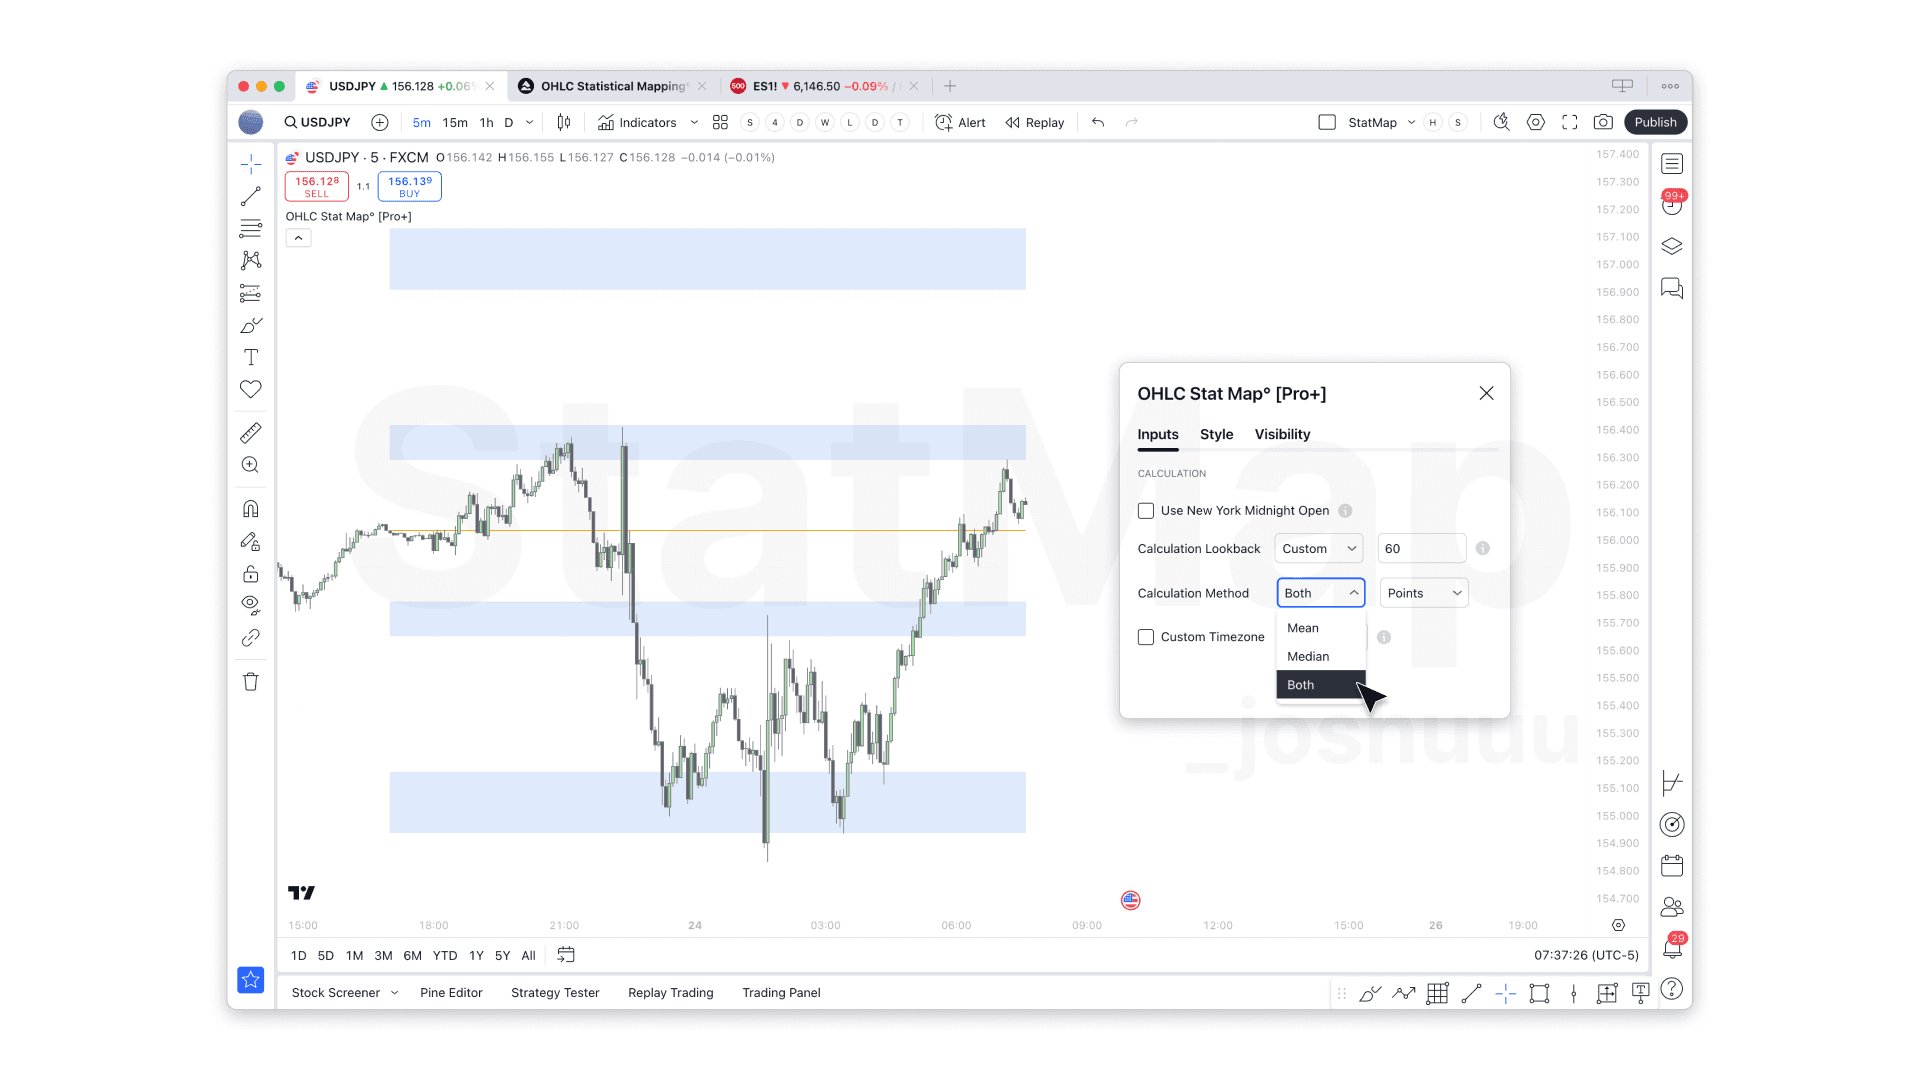
Früher musstest du dich zwischen Mean oder Median entscheiden. Auf Wunsch der Community gibt es jetzt die Option, beide Berechnungen parallel anzuzeigen. Wählst du „Both“, zeichnet der Indikator eine Box vom Mean- zum Median-Level und markiert die gesamte Spanne als neuen Point of Interest. Das hilft dir:
- Die Abweichung zwischen Mean und Median auf einen Blick zu sehen.
- Zonen potenzieller Preisreaktionen intuitiver zu erkennen.
- Besser abzuschätzen, wo echte Wendepunkte entstehen könnten.
Mehr zu Mean vs. Median findest du in diesem Beitrag.
Verbesserte Midnight Levels
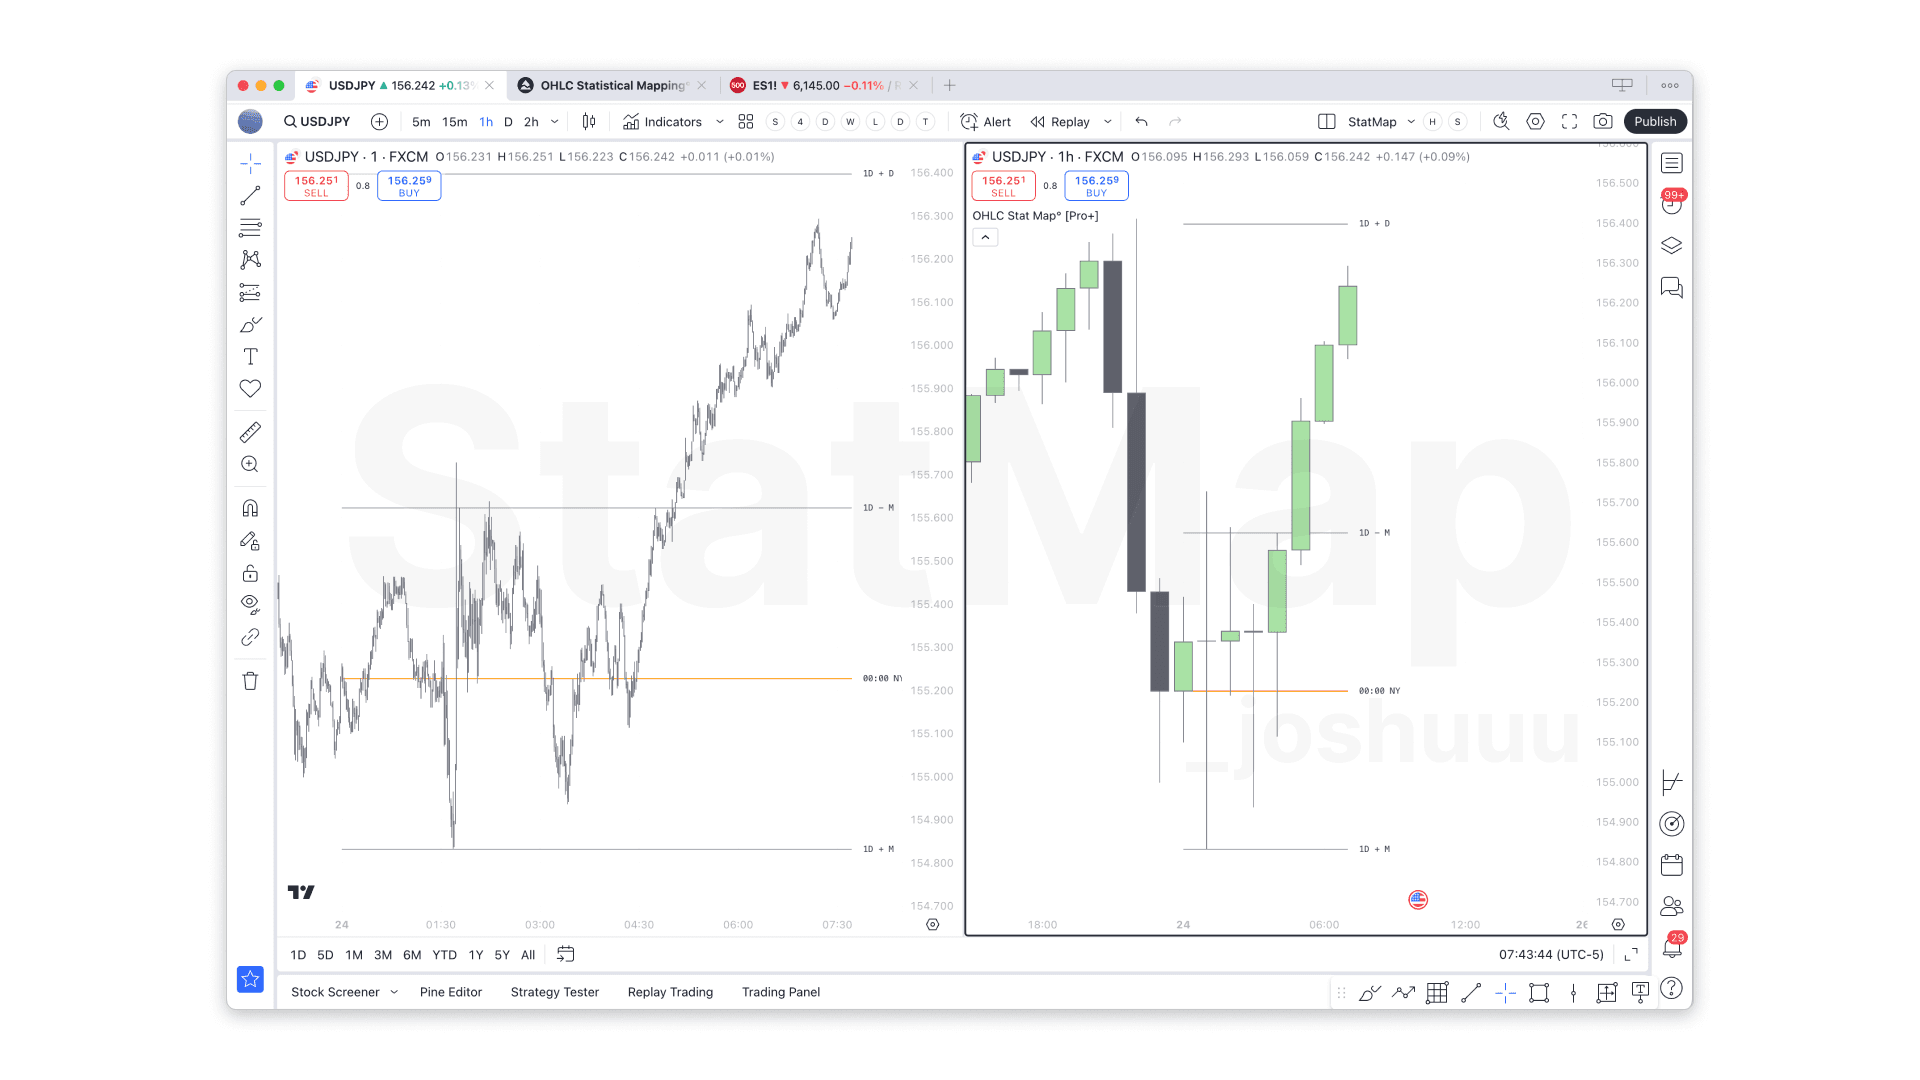
Wir haben die Mitternachts-basierten Daily Levels deutlich überarbeitet. Einige Nutzer sahen zuvor Abweichungen beim Wechsel zwischen Timeframes. Jetzt passen sich die auf New York Midnight verankerten Daily Levels automatisch an und bleiben auf allen Timeframes konsistent. Das bringt:
- Zuverlässiges historisches Backtesting für Daily Sessions.
- Sanftere Übergänge beim Timeframe-Wechsel.
- Harmonisierte Levels als robustere statistische Basis.
Auf Futures-Charts können Midnight-Projektionen auf allen Timeframes bis Daily geplottet werden, auch wenn keine Kerze exakt am Midnight-Open liegt. Auf Nicht-Futures-Charts sind sie für stündliche Timeframes und darunter verfügbar.
Kleine Fixes & UI-Verbesserungen
Wir haben früher kontinuierliche Futures empfohlen, weil sie viel Historie bieten. Das ist nicht mehr nötig: Auch Quartalskontrakte liefern jetzt die gleiche Präzision. Außerdem sind kleinere Bugs behoben und die Performance ist besser. Das Settings-Menü ist neu gestaltet und noch intuitiver, damit du die StatMap-Indikatoren schneller anpassen kannst.
Loslegen mit V3
Bestehende Abonnenten aktualisieren einfach den TradingView-Indikator auf V3 (bei der veröffentlichten Version passiert das automatisch). Neu bei OHLC StatMap [Pro+]? Schau auf unsere Website oder komm auf Discord, um zu sehen, wie unsere statistischen Indikatoren dir im Markt einen Vorteil geben.
Danke für euer Feedback – teilt weiter Ideen im Community-Discord, damit wir stetig verbessern können. Happy Trading!
— Das OHLC StatMap Team
Related Articles
StatMap V4: Major Update
Das größte Update für Statistical Mapping & Volatility: V4 vereint Workflows, bringt mehr Flexibilität und neue Features.
Introducing Statistical Volatility 2.0 👀
Statistical Volatility 2.0 bringt Filter, Displacements und flexiblere Steuerung für schärfere Analysen.