Was ist Statistical Volatility?
Das Kernkonzept
Statistical Volatility analysiert historische Volatilitätsmuster, damit du erkennst, wann und wo größere Preisbewegungen wahrscheinlich sind. Das Tool liefert einen statistischen Rahmen, um ungewöhnliches Marktverhalten und Wahrscheinlichkeitszonen für Umkehr zu identifizieren.
So funktioniert es
Der Indikator sammelt Volatilitätsdaten vergangener Perioden und projiziert erwartete Volatilität für aktuelle und künftige Timeframes. Durch den Vergleich des aktuellen Verhaltens mit dem historischen Durchschnitt erkennst du statistisch bedeutsame Bewegungen.
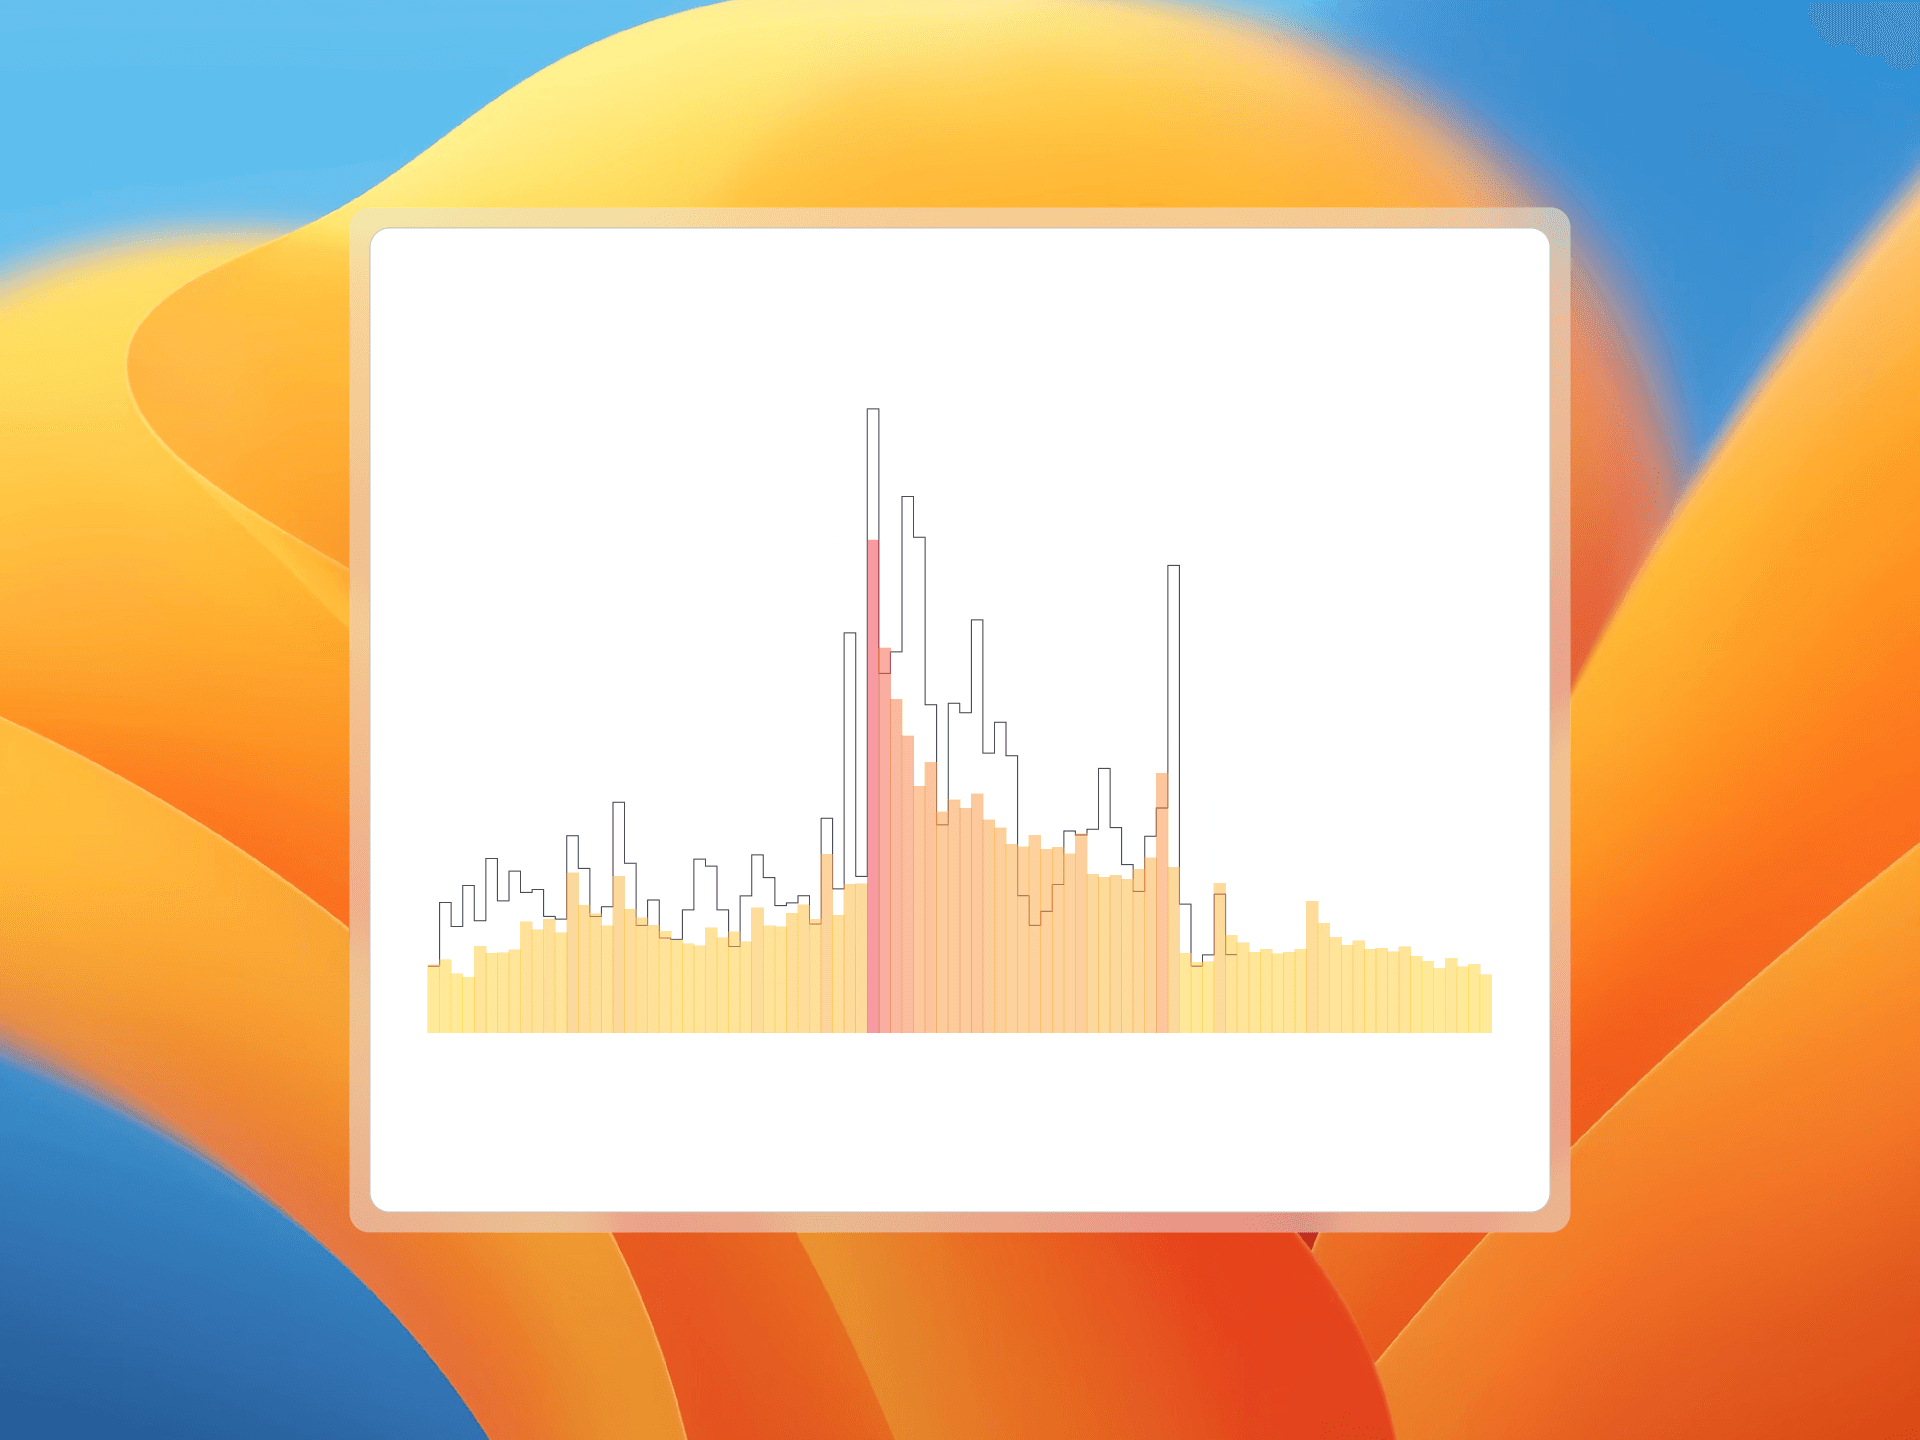
Heatmap- und Histogramm-Ansicht
Volatilitätsdaten werden als Heatmap oder Histogramm visualisiert, sodass du erwartete Volatilität und Muster über Zeiten und Preisbereiche schnell siehst.
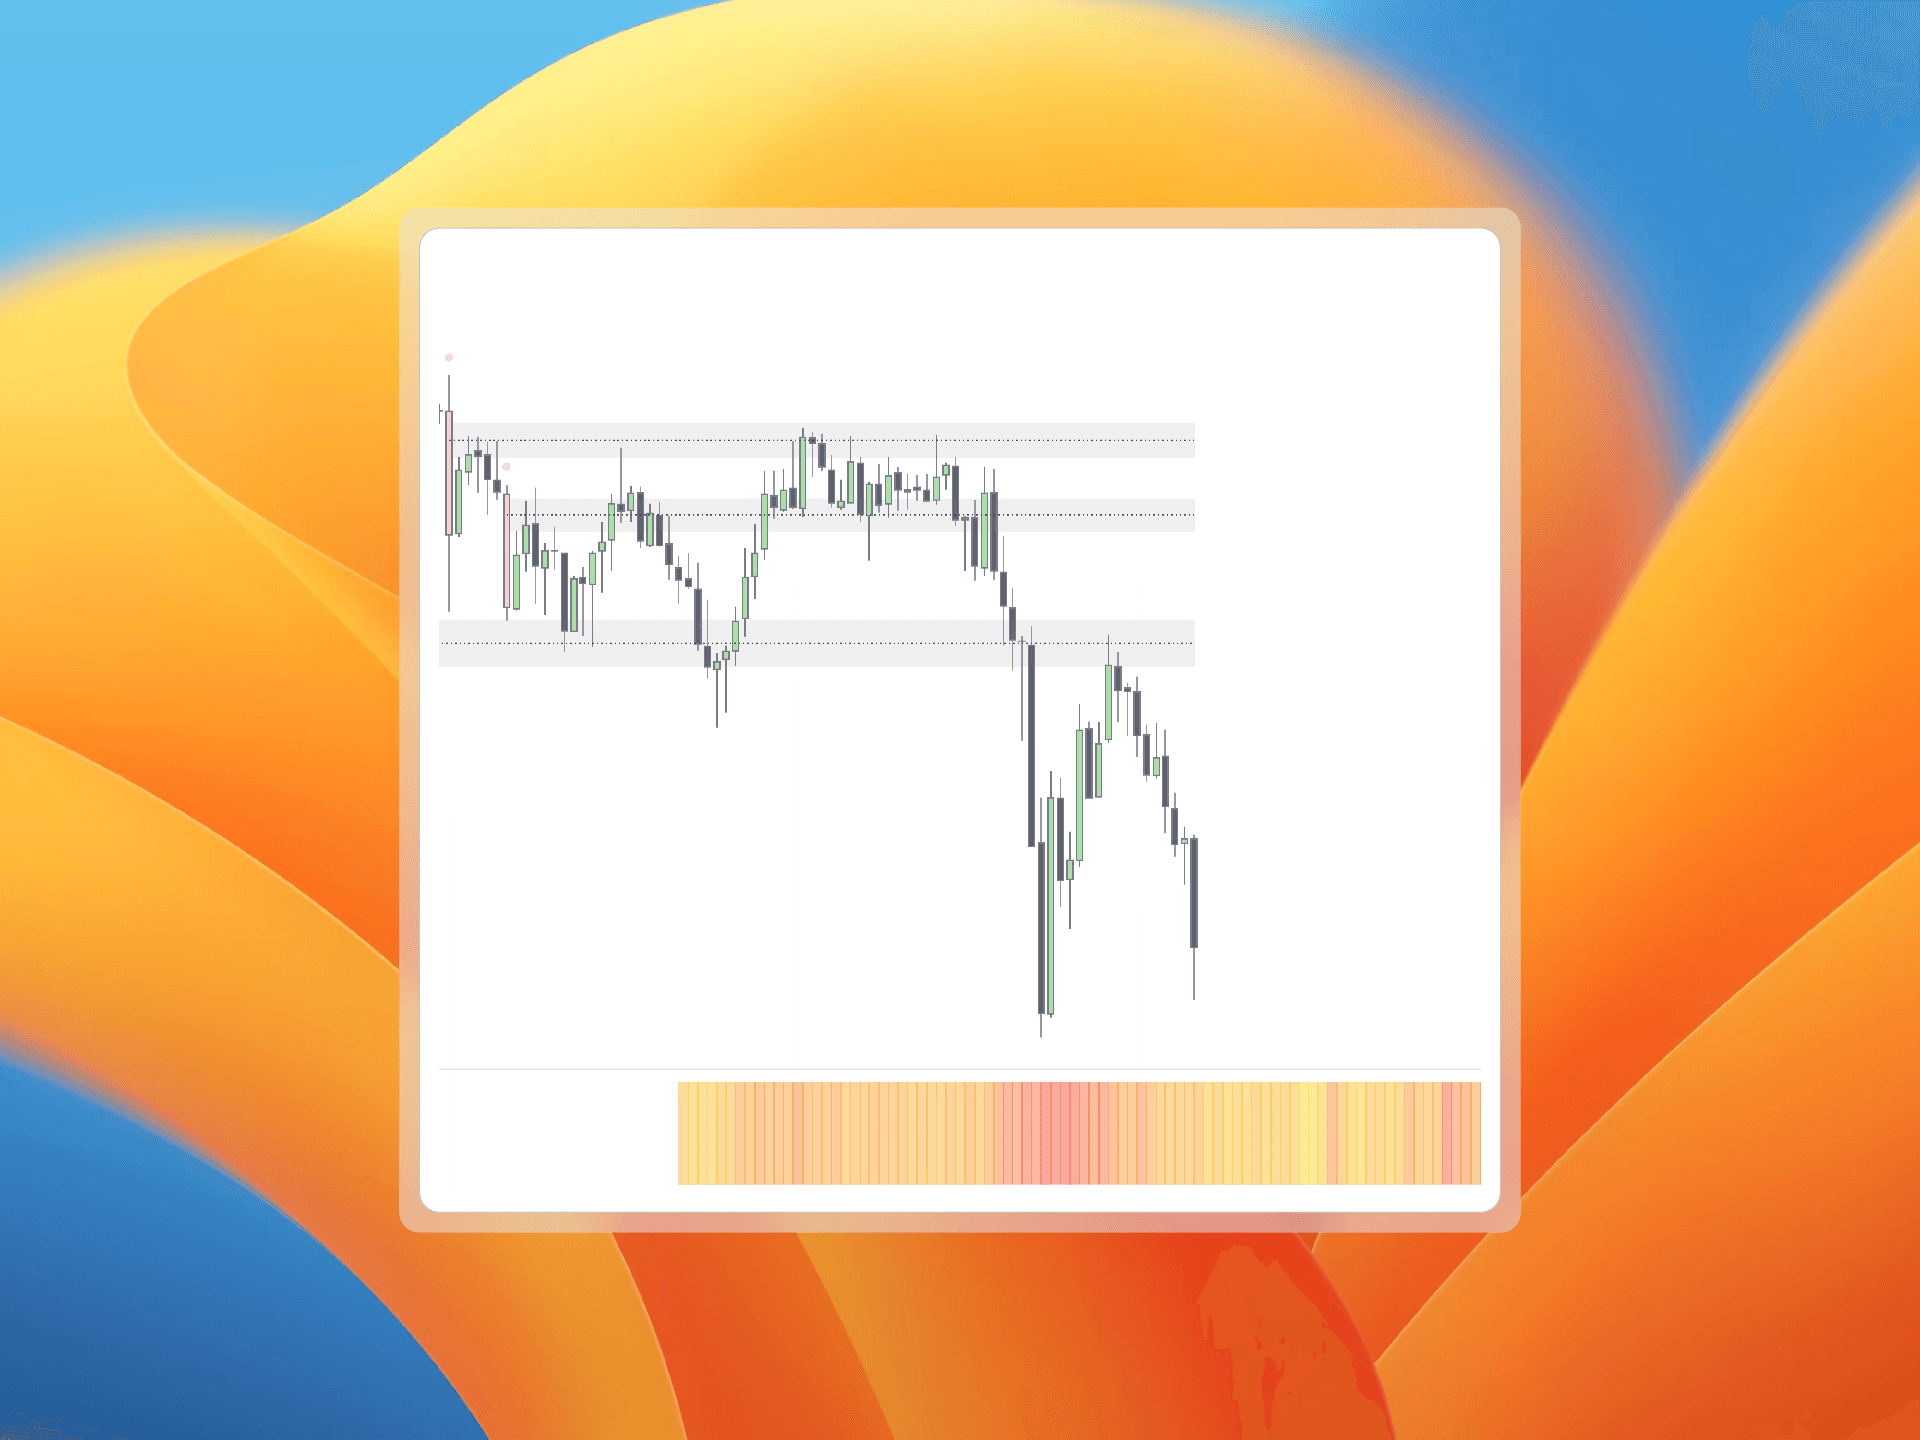
Echtzeit-Displacement-Erkennung
Kerzen mit ungewöhnlicher Volatilität gegenüber dem Durchschnitt werden hervorgehoben. Aktuelle Volatilität lässt sich über historische Daten legen, um Abweichungen früh zu erkennen.
So siehst du, wann Bewegungen statistisch signifikant sind und kannst Zonen mit erhöhter Umkehrwahrscheinlichkeit ausmachen.
Graph-Panel: Killzones finden
Das Graph Panel trackt aktuelle Volatilität in Echtzeit gegen historische Muster. Es zeigt „Killzones“, also Zeitfenster mit konsistent erhöhter Volatilität (z. B. Asien-Open, London-Open, US-Daten, NY-Equity-Open).
Der Overlay-Vergleich macht sofort sichtbar, ob das aktuelle Umfeld typisch oder außergewöhnlich ist.
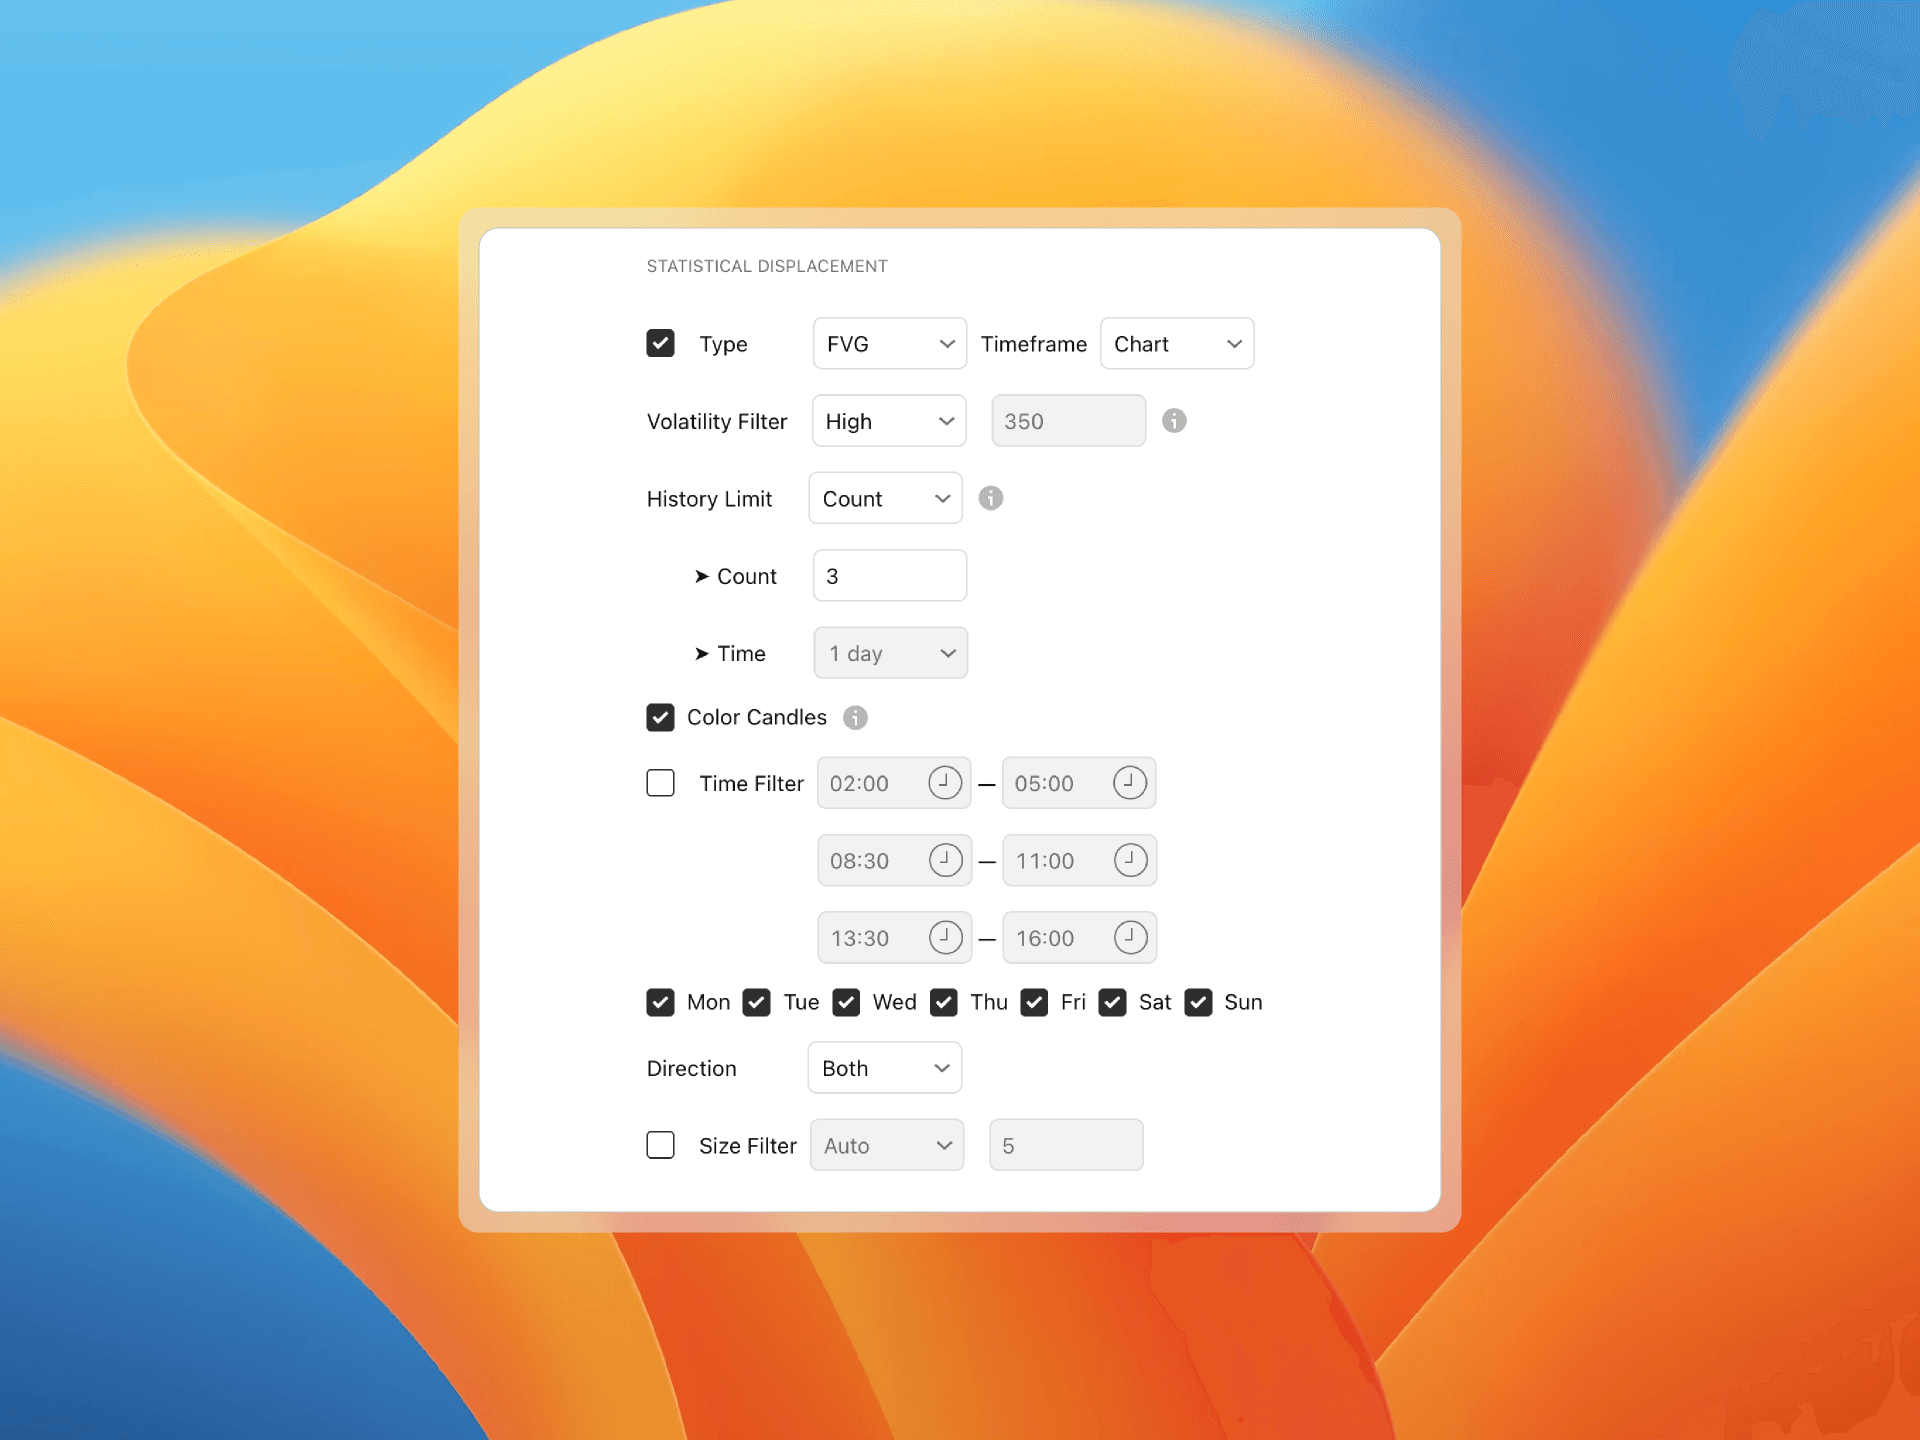
Statistical Displacement Strength
Konfigurierbare Displacement-Levels filtern Bewegungen nach statistischer Signifikanz.
Visualisierungen
Wähle zwischen FVG-Darstellung, High-Low-Range oder Open-Close-Fokus – je nach Analyseansatz.
Zeit- und Tagesfilter
Filtere auf relevante Zeiten/Tage und blende Rauschen aus weniger bedeutenden Perioden aus.
Praktische Anwendung
Durch Echtzeit-Displacements plus Filter hilft dir StatVol:
- die Zeitfenster und Preisbereiche zu finden, in denen statistisch große Moves auftreten
- Entries nach erwarteten Volatilitätsfenstern zu planen
- Stops/Targets an typische Volatilitätsspannen anzupassen
- Abweichungen vom Normalverhalten sofort zu erkennen
Zusammenspiel mit Statistical Mapping
Statistical Mapping liefert Preislevel und Umkehrpunkte; Statistical Volatility ergänzt Intensität und Timing. Zusammen entsteht ein vollständiger statistischer Rahmen.
Nutze StatVol, um Moves Richtung StatMap-Level auf Signifikanz zu prüfen – so stellst du sicher, dass es mehr als nur normales Rauschen ist.
Konfiguration
StatVol einstellen:
- Statistical Volatility Settings öffnen
- Displacement-Strength wählen
- Visualisierung (FVG, High-Low, Open-Close) wählen
- Zeit- und Tagesfilter setzen
- Graph Pane aktivieren für Live-Tracking
Damit passt du StatVol an deinen Stil und Timeframe an – mit statistischer Strenge für relevante Marktbewegungen.
Related Articles
StatMap und StatVol kombinieren
Lernen Sie drei effektive Methoden, um StatMap und StatVol Indikatoren für hochwahrscheinliche Trading-Setups mit statistischen Displacements und wichtigen Levels zu kombinieren...
Custom Daily Anchor
Richte den täglichen Anker auf die tatsächliche Session deines Instruments aus, statt auf Mitternacht.